Can the U.S. Alternate Energy Solar Panel Manufacturing Industry Compete?
Photovoltaics – Converting Sunshine into Electrical Energy
In the early 1980s, the United States led the world in manufacturing photovoltaic solar energy. Three prominent companies, Arco Solar, Shell Oil and Siemans Solar, installed systems on the roofs of homes and apartments in Hawaii and the world’s first large-scale PV solar field in Paso Robles, California.
President Jimmy Carter even installed some on the roof of the White House. However, in 1985, President Ronald Reagan eliminated government credits supporting the infant industry. He even removed the panels on the White House roof.
Short sighted? Perhaps or maybe it was just the current refrain, “Drill Baby Drill”?
This article briefly explores Dr. Michael Porter’s reasoning for his 1990 publication, The Competitive Advantage of Nations, analyzing fundamental forces driving nations’ competitive advantages.
Porter identified six key factors contributing to a country’s current and future global competitiveness. We will review Porter’s conclusions in context with his updates to his original study and subsequent selected literature.
Dr. Paul Krugman won the Nobel Prize for his academic literature on Free Trade Theory, a new view of general Trade Theory. This article also includes a brief review of Dr. Krugman’s New Trade Theory and thoughts on using Tariffs, often suggested by politicians to save U.S. industries and reduce imports.
With the advent and acceleration of globalization in the past ten years, some studies suggest that Porter’s assumptions and dynamics should be updated and modified. Although this article considers these points of view, it is beyond the scope to thoroughly analyze the body of literature and the validity of these arguments.
This article’s analysis aims to review the relatively nascent United States alternative energy markets in today’s global environment and compare and contrast these with the experiences of select countries.
Finally, the author proposes specific industry and trade policies to advance U.S. competitiveness in this emerging industry sector and reflects on their coherence with Porter, the economic literature and Free Trade.
Keywords: Porter, Krugman, Competitive Nations, New Trade Theory, Alternative Energy, Solar Energy, Tariffs, Globalization, International Competition, Drill Baby Drill, China solar energy
Overview
Polysilicon is the base solar cell raw material, and Wafers are sliced from manufactured polysilicon single cell czochralski ingots. Once processed with texturing baths and doped with implanted chemicals a Positive-Negative junction (a “P-N Junction”). PV Cells can now produce electricity when exposed to sunlight.
A similar process occurs with amorphous photovoltaics. This is called amorphous silicon or a-SI. Silicon is converted to a chemical vapor and deposited as thin films on substrates such as glass or other flexible materials.
A-Si technology has better lower light absorption and a higher tolerance for temperature variations than crystalline silicon cells. Thinner layers can be used, reducing material and manufacturing costs. However, a-Si photovoltaics have lower efficiency in converting sunlight to electricity and less long-term stability over time than their crystalline counterparts. Crystalline silicon cells typically have 15% to 22% efficiency, while a-Si solar cells range only 6% to 10%.
Solar panels are the final PV product.
While U.S. citizens continue to install solar panels supported by today’s government incentives, today’s United States’ PV solar manufacturing is seriously behind since 1985 when Atlantic Richfield (ARCO) led the world and installed the first 5 megawatt solar installation in Paso Robles, California. Wood Mackenzie’s research recently predicted that China will hold 80% of the world’s PV manufacturing, including both single-cell and amorphous photovoltaics.
Alternative Energy Industry Dynamics
The U.S. alternative energy markets today consist primarily of generating electricity by:
1. Converting water into steam to drive turbines (e.g., solar thermal and geothermal).
2. Converting sunlight into direct current electricity (e.g., photovoltaics).
3. Wind powered turbines.
Alternative fuels (e.g., biofuels) and electric or hybrid electric-fuel vehicle engines are also typically included. However, battery powered tools and autos such as the Tesla, are ways of storing and using electricity from any source, whether from traditional or alternative electricity sources.
If we take but one of these alternative energy sources, such as solar photovoltaics, we can demonstrate the dynamics operating within the U.S. and global alternative energy market. Consistent with Porter’s (1990) allowance for dramatic changes affecting national industries, the international 1973 oil crises sparked interest in alternative energy sources.
In an attempt to combat rising unemployment and inflation with stagnant business growth (sometimes termed “stagflation” ), the Carter administration (1977-1981) turned to increased government spending and deregulation of specific industries such as railroads, airlines and trucking.
In 1977, President Carter established green tax credits and corporate financial incentives to encourage America’s move toward alternative energy. In June 1979, thirty-two solar thermal panels were installed on the White House roof. At the dedication, Carter said, “A generation from now, this solar heater can either be a curiosity, a museum piece, an example of a road not taken, or it can be a small part of one of the greatest and most exciting adventures ever undertaken by the American people” (as cited by Wihbey, 2008).
The incentives attracted large oil companies such as U.S. based Atlantic Richfield (ARCO) and the Dutch multinational oil company, Shell, to enter and grow the domestic U.S. solar photovoltaic (PV) market.
The industries for innovative single cell czochralski crystal silicon based technology startups, research into advanced amorphous PV technologies, and improvements in deep cycle batteries to store the energy created rapidly grew. In 1982, ARCO Solar installed the first, large industrial 5 megawatt facility in California. Daily, 756 solar panels tracked the sun azimuth throughout the seasons from east to west.
Small photovoltaic industry clusters began in the California-Arizona area and a few states on the east coast.
With a lagging economy and change of administrations in 1982, the Reagan administration’s industrial and economic policies took the position that government was the problem, not the solution to the U.S. economic malaise. Deregulation of industries continued, by 1985 the green tax and financial incentives were allowed to expire, and – although a small contingent of firms survived – the U.S. photovoltaic alternative energy movement was effectively dead. In 1986, the White House solar thermal panels were removed (Wihbey, 2008). In 1988, interest in ARCO’s 5-megawatt project waned, and by 1995, all PV panels had been removed.
What was missing, and why did this occur?
Reflecting on Porter’s four basic forces driving domestic competition, one was missing – Demand Conditions – the domestic market demand for an industry’s products or services.
President Carter recognized a future need for alternative energy resources, but President Reagan looked to the demand for solar energy, and that market was in its infant stage. President Reagan allowed government policies (i.e., the tax incentives) for PV solar to expire, and companies such as ARCO no longer found it profitable on a combined financial basis, and it exited the industry with many others.
Other companies followed similar routes, either eliminating or curtailing future industry efforts.
Within the last 15 years, there has been a revival in the search for alternative energy sources, and these industries are again growing, including the solar PV industry. This time, countries such as Germany, Italy, the Czech Republic, and Japan led the renaissance.
Japan’s PV market is highly competitive and tends to be mostly for domestic use with some exports. Taiwan had entered the market, exporting 97% of all production and was ranked second in production capacity in 2011 (Su, 2013)
But China was not far behind!
China’s government-subsidized investment in PV manufacturing facilities to achieve economies of scale in declared “clustering” regions of China including Jiangsu Province and Chengdu in Sichuan Province.
Figure 1 shows the world production capacity as of 2019. This has driven down global wafer and module prices shown in Figure 1, benefitting the industry’s continued growth.
Figure 1 PV Manufacturing Comparison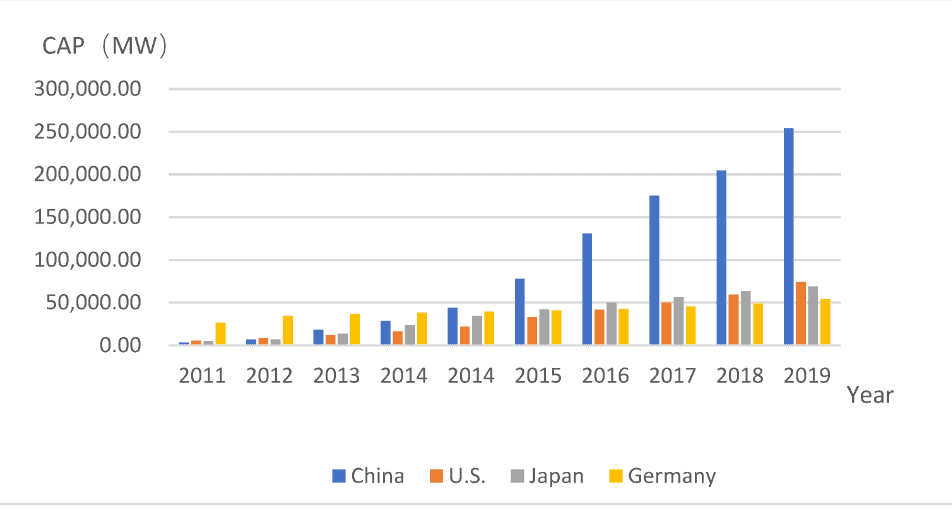
Source: MPDI, https://www.mdpi.com/energies/energies-15-00306/article_deploy/html/images/energies-15-00306-g001.png
Global PV Production Capacity continued to improve economies of scale, anticipating increasing investment returns from the PV cell and module export industry.
Figure 2 China’s PV Manufacturing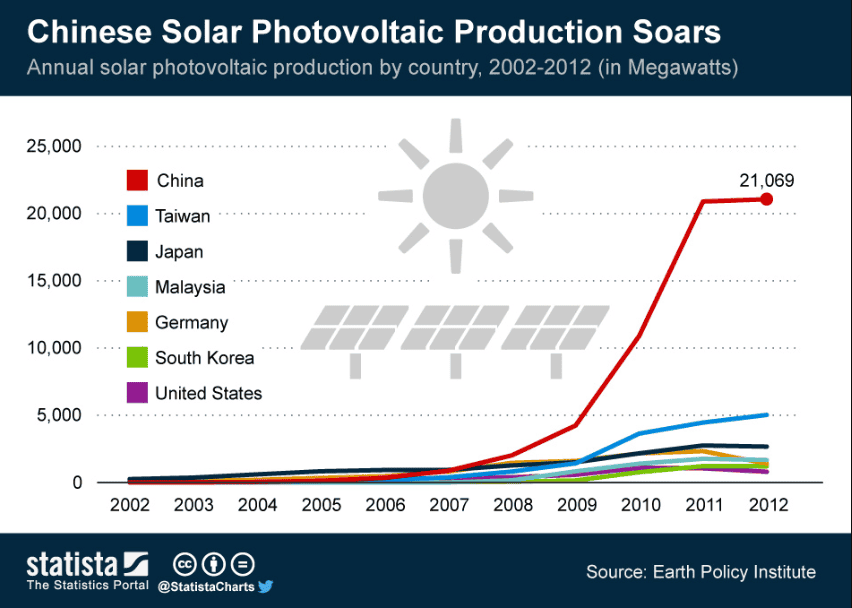
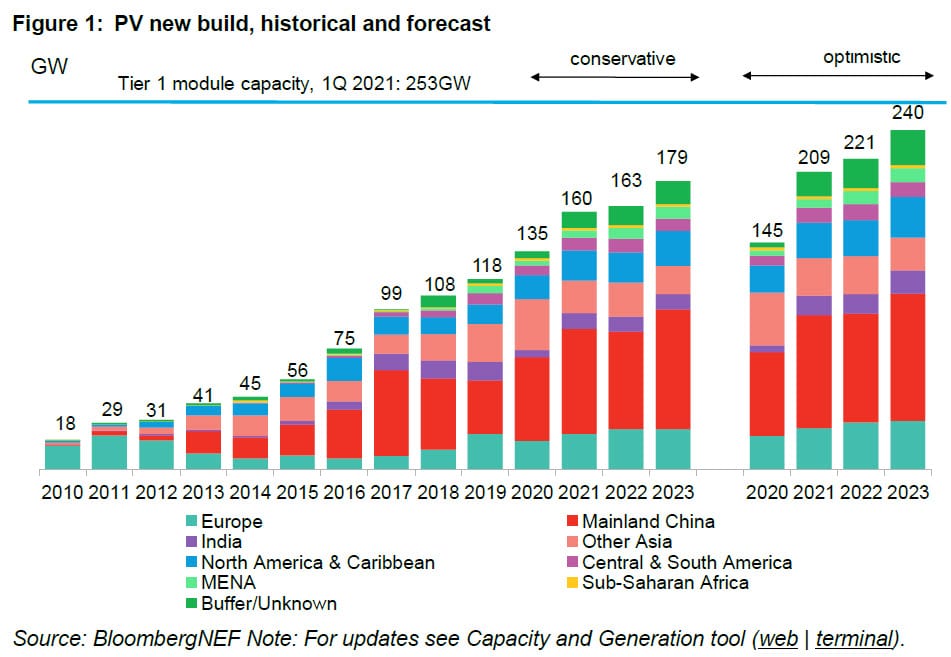
Figure 3 Global PV Production Capacity 2011-2019
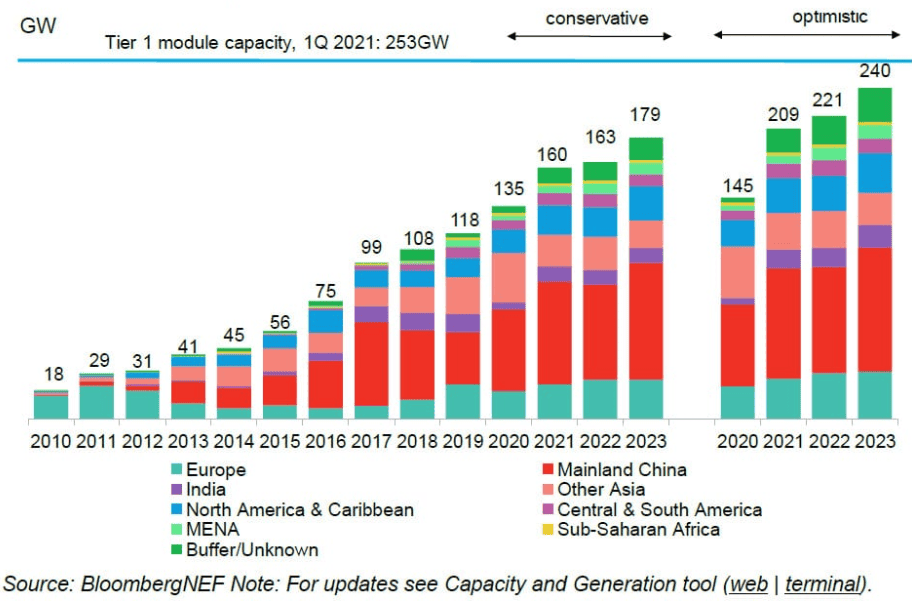
Source: Bloomberg NEF. Retrieved from https://pv-magazine-usa.com/wp-content/uploads/sites/2/2021/02/vcsPRAsset_3487276_190133_e0c09902-1edc-4d80-bbb9-365b8aa3e9e5_0.jpg
So what happened?
One could conclude that these trends demonstrate support for Porter’s Diamond Model,
the positive effects of government subsidies and industry clustering, and
the benefits of U.S. innovation with China’s implementation of those innovations.
One could also conclude that this supports both New Trade Theory and New Economic Geography.
Recent 2022 data suggests that these conclusions are correct; however, given fluctuations in the PV world market, there may be excess PV manufacturing capacity, and these current trends may not be sustainable.
The body of research literature and data support that a country’s comparative advantage in innovations is not sustainable without a highly skilled, educated workforce and global protection of technological intellectual property. We see this and the power of “clustering” in the PV industry, especially in the advanced silicon chip industry, currently controlled by Taiwan Semiconductor Manufacturing Company (TSMC). For more on this, read The Chips That Make Taiwan the Center of the World by Chris Miller in TIME Online (https://time.com/6219318/tsmc-taiwan-the-center-of-the-world/ ).
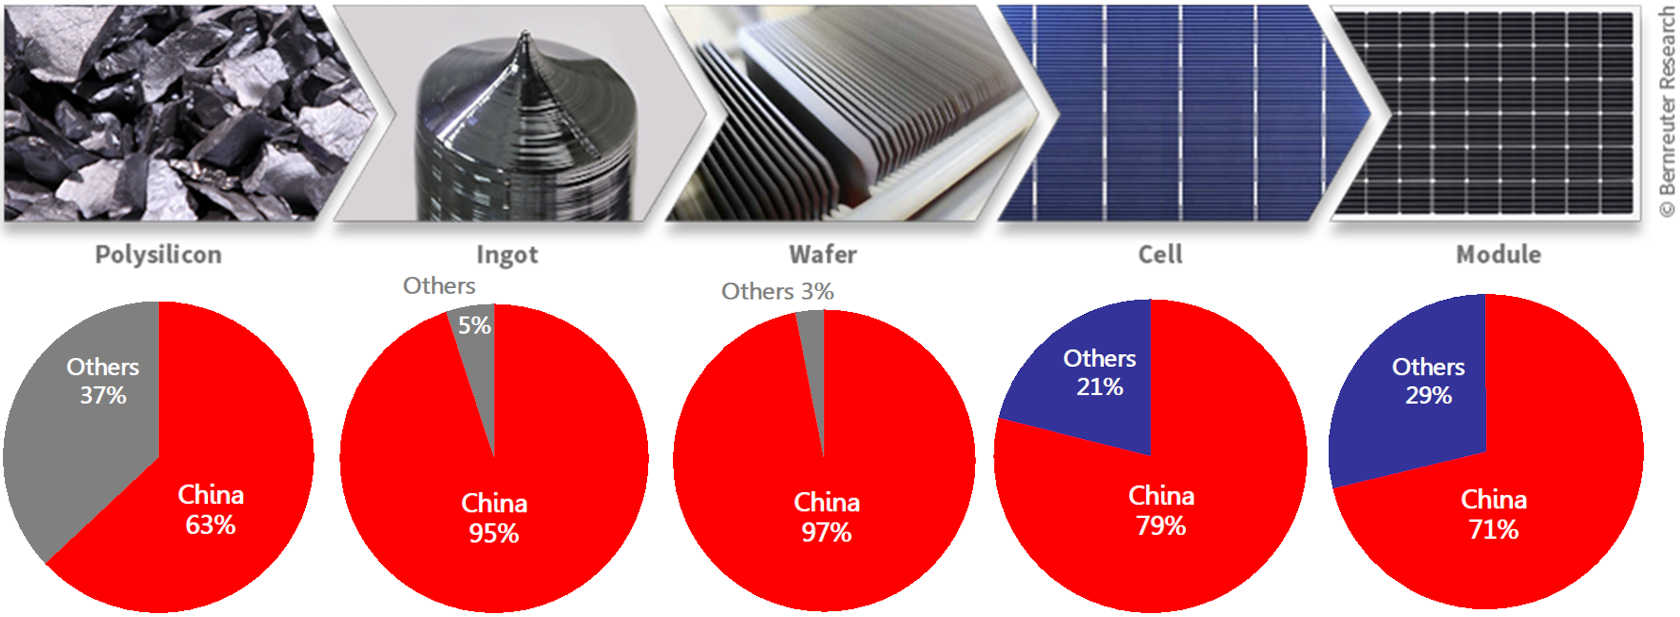
Figure 4 China’s Share of World PV Manufacturing Supply Chain
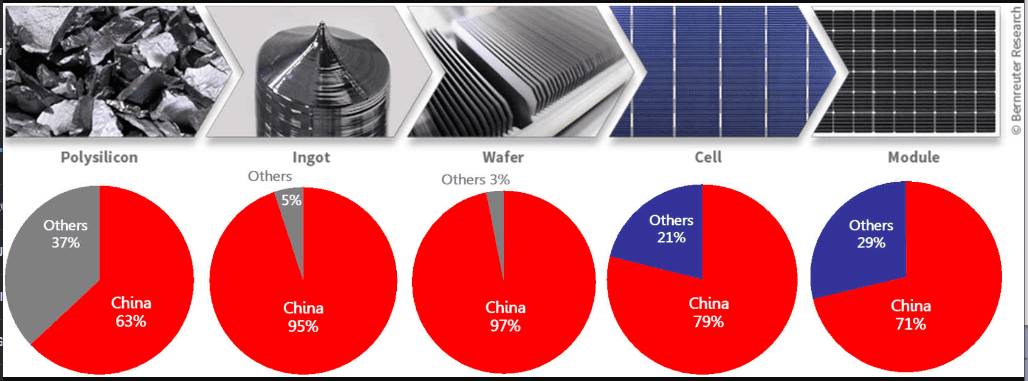
Source: https://www.bernreuter.com/files/data/solar-industry/value-chain/china-production-share-in-solar-value-chain-2019.jpg
New Trade Theory and Porter’s Diamond Model in U.S. National Policy
In 1990 Michael Porter published The Competitive Advantage of Nations (Porter, 1990). This article briefly explores Porter’s reasoning for his original publication analyzing key forces driving the competitive advantage of nations. Porter’s conclusions are reviewed in context with updates from Porter and subsequent select literature.
Porter’s study of over 100 industries in 10 countries constituted 50 percent of 1985 world exports. Its premise is that nations – like companies and industries – compete in the world markets for their own nationalistic objectives such as growth in gross domestic product (GDP), the country’s international attractiveness for foreign direct investments (FDI), natural and human resources (workforce and brain power), and political- economic influence.
Based on his study, Porter created the Diamond Model, providing a construct for thinking about successful competition among nations. The essential premise of Porter’s model is that a country’s industries initially compete domestically and regionally and the pressures of this competition improve the industry’s innovative nature, developing competitive advantages that can then be extended globally. It assumes the local, regional and national companies survive.
Figure 5 Porter’s Diamond Model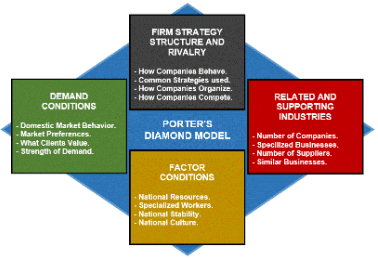
Porter identified six key factors contributing to a country’s current and future global competitiveness. With globalization arriving and accelerating in the past few years, some studies suggest that Porter’s assumptions and dynamics should be updated and modified.
Applying Porter’s Diamond Model and New Trade Theory to U.S. National Policy
Porter’s Diamond Model Determinants
The study and resulting model (Porter, 1990) were based on two parameters.
First, as a proxy for national trade success, the study focused on each country’s industries where domestic companies were internationally successful. Success was primarily defined as either or both
a) significant exports to a broad array of other countries, and
b) substantial investment of the firm’s domestically developed skills and assets into foreign markets.
Each industry deemed “successful” was then analyzed in a snapshot of 1971, 1978, and 1985 performance. This information was analyzed and refined to derive relevant conclusions about competitive advantage.
Secondly, the study (Porter, 1990) investigated over 100 key industries, the reason any one country’s industry began, how the industry grew, and how they became internationally competitive. Finally, it reviewed how this competitive advantage was maintained or lost over time. Contrasting the concepts of national comparative advantage, the study did not include industries dependent upon natural resources.
Porter’s analyses (1990) conclude that there are four basic forces driving domestic competition:
1. Factor Conditions – the presence of key factors of production such as skilled labor, access to technology, or infrastructure;
2. Demand Conditions – the domestic market demand for an industry’s products or services;
3. Related and Supporting Industries – domestically available supply and distribution chain industries or related industries that are internationally competitive; and
4. Firm Rivalry, Structure, and Strategies – those national policies governing business and the cultural organization and management of such businesses.
Porter (1990) did not fail to recognize that both the role of chance and important disadvantages (e.g., a significant lack of certain national resources) are two critical elements in success. Chance and Disadvantages constitute the fifth and sixth points of the diamond. Unfortunately, the options for chance are extensive, unpredictable, and include anticipated surprises (such as major breakthrough inventions and technologies), a significant change in world demand, a shift in consumption preferences (business and/or consumer), foreign political decisions, changes in government, dramatic changes in the exchange rate, sudden price shocks, regional or national wars, and unforeseen government failures (economic and/or political).
The study has been augmented over the past several years (Porter, 2001, 2008, 2012) and reviewed by a large, diverse body of academics and organizations. Porter continues to maintain that the ability of a nation’s industries to innovate and build on strategic assets are key to sustainable success. Countries with significant disadvantages are required to innovate and upgrade skills and assets to compete. Japan has been such an example. With limited space and employees, Japan innovatively created just-in-time manufacturing and highly automated, flexible manufacturing lines. Countries with an abundance of a resource such as low cost labor in India and China, may deploy that asset quite inefficiently, ultimately making it difficult for these industries to compete long term internationally.
Since 1990, increasing globalization (Friedman, 2006; Kynge, 2006) and disaggregation of the supply chain (Meredith, 2007) bring Porter’s original constructs and conclusions into question.
Global multinational companies appear to be able to divide and specialize endlessly to seek out the lowest cost resources, most favorable business climate, and selectively upgrade their assets based on any one country’s endowments. One may conclude that these are then more like nationally autonomous corporate-states (as opposed to nation-states). Porter (1990, 1991) suggested that these multi-national enterprises are strongly influenced by the home base. He states, “a firm can only have one true home base for each distinct business or segment.” (Porter, 1990, p. 606). Other studies, however, conclude that the largest, successful multinationals’ foreign strategic business units are influenced by each unique country environment in which they operate and modify their strategies accordingly (Rugman&Verbeke, 1993; Rugman, 2009; Hejazi, 2009).
Ryu and Simpson (2011) suggest that domestic competition of multinationals may hone the company’s competitiveness within its domestic market, but do not necessarily translate to global competitiveness. Reviewing three large multinationals – Wal-Mart (U.S.), Carrefour (France), and Tesco (Britain) – the authors identify three key elements for retailers operating in global (non-domestic) markets. For foreign markets, companies must:
1. Adapt to the foreign country’s culture and market;
2. Attain competitive advantage in the domestic or regional foreign market; and
3. Balance corporate mindset to the global market and strategies.
Trade Theories
Ricardo’s Trade Theory (Ricardo, 1817 as cited by Sraffa, 1951), has played a significant role when economists and governments consider a nation’s comparative advantages and economic policies. Traditional trade theory suggests that the balance of trade (e.g., value of imports versus exports for product manufacturing or services) will move to those countries with a comparative advantage – countries that do what they can do best. A country that can provide internationally competitive products or services at the lowest labor cost (e.g., China and India) enhance that nation’s ability to then purchase the higher value goods and services of foreign countries that require higher-level skills and resources (e.g., iPhones or laser weaponry).
Free trade theory considers this a positive sum game. As an example, when the U.S. is experiencing the apparently negative domestic effects of outsourcing or competition from lower-cost foreign imports, trade theory asserts that some U.S. employment and GDP may initially be lost. The foreign country will gain U.S. market share and global market share. However, the U.S. will enjoy lower-cost goods and as the foreign countries become more successful, their demand will increase for high-value goods that require U.S. skilled labor and technologies. In the long term, the U.S., therefore, will still see increasing domestic GDP and skilled job growth.
Trade theory remains tied to its roots of comparative advantage. However, New Trade Theory (NTT), strategic trade theory (e.g., Krugman, 1994, 1991), and Porter’s Diamond Model (Porter 1990, 1991) would also suggest that countries can improve their competitiveness. Overall, the literature indicates that free trade and globalization will eventually benefit all countries.
Studies of other countries support this. In India for example, a recent study (Hasana, Mitrab, Ranjanc, &Ahsand, 2012) concludes that unemployment does not increase in Indian industries when trade protections are reduced, especially in cities and net export industries. Recently, however, Nobel laureate Dr. Paul Samuelson has questioned the perceived benefit to the U.S. (Samuelson, 2004). Discussed further below, he suggested that for the past fifty years, net win-lose have favored developing nations where “imitative inventions” (Samuelson, 2005, p. 243) are available. Furthermore, he posits a continual leveling of geographic economic differences and will continue to plague advanced nations for the next fifty years.
Dr. Paul Krugman, 2008 Nobel laureate, contributed a body of work (e.g., Krugman, 1991) incorporating the rigor of a new mathematical model and updated trade theory regarding both returns to scale (constant, increasing or decreasing) and economic geography. That is, that manufacturing will occur in only a few sites due to efficiencies of economies of scale, and these sites will be near their markets.
As another example, oil travels thousands of miles from multiple locations to accumulation sites before finally traveling to a few gasoline refineries with the required economies of scale close to its markets. Of course, changes in underlying costs (e.g., transportation cost from railroad infrastructure growth or digital delivery over the internet) or shifts in market demand may alter these geographic preferences.
New Trade Theory (NTT) and New Economic Geography (NEG) were
Krugman’s contribution. Both NTT and NEG continue to support free market trade concepts.
Samuelson (2004) created a money-metric-utility to measure the actual gains and losses of countries’ industries. It partially refuted NTT and suggested that for the past fifty years, net win-lose have favored developing nations where “imitative inventions” (Samuelson, 2005, p. 243) are available. That is, with today’s interconnected global world and technology, net gains can now go to country economies where low cost, educated people are available to business –an imitative process rather than an innovative one. Furthermore, he posits a continual leveling of geographic economic differences and concludes that lose-win will continue to plague advanced nations for the next fifty years. Regarding claims in the literature that he favored protectionism, he later clarified that, “…leaving or compromising free trade policies will most likely reduce future growth in well-being in both the advanced and less productive regions of the world. Protectionism breeds monopoly, crony capitalism and sloth” (Samuelson, 2005, p. 242).
Consistent with New Trade Theory, Krugman’s study (1990) there is an argument for some government support of the nascent U.S. PV manufacturing industry.
Porter’s Clustering
Porter’s analyses of “clustering” (1990, 1990a, 2008, 2012) and the derived industry competitive advantage provide other advantages to nations. These views are generally consistent with Krugman’s analysis (1991). Industries will tend to locate regionally but for different reasons (Furman, Porter, and Stern, 2002). Porter concludes that this regional and national clustering contributes to innovation (Furman, Porter, and Stern, 2002; Porter, 1990, 1990a, 2008, 2012).
Given the disruptive globalizing nature of new technology (e.g., global internet connectivity) the more recent off-shoring of higher level skilled U.S. white-collar jobs to India, China, and Taiwan may not be good for the U.S. long term (Samuelson, 2004, 2005).
India is accelerating influence in Information Technologies (IT), China in manufactured goods and Rare Earth production (e.g., Lithium), and Taiwan in the world’s most used, sophisticated silicon chips.
In 2004, economist Robert Feenstra – a University of California, Davis trade economist said, “This is a whole unexplored question that is very controversial, and nobody has a clue about what the numbers are” (as cited by Bloomberg, 2004).
Strategic Industry Protection
Krugman (1991, 1994) concludes that NTT supports certain benefits for the government to intervene in international trade. Krugman argues that although imperfect markets may lead to suboptimal results, both external economies (economies of scale found in vertically integrated production of intermediates that are not traded) and oligopolies create distortions inconsistent with historical unfettered free trade theory.
Tariffs and non-tariff barriers may be perceived as protectionism, and to some extent they are just that. Protectionism is usually an effort to slow down or block global adjustments such as increasing unemployment by displacing labor, production geographic relocations, or changing product requirements.
The global balance for efficiencies in the free market is sacrificed – at least in the short term – for the business industry economy, employment and higher wages. Studies conclude (e.g., Krugman 1994, Dixit, 1998; Baldwin and Krugman, 1988) that limited tariffs do not significantly affect free trade and, in fact, may improve domestic market entry, competition , exports and social welfare. Figure 6 represents the percent of non-tariff market barriers to entry for eleven developing countries
Figure 6 Import Non-Tariff Barriers to Entry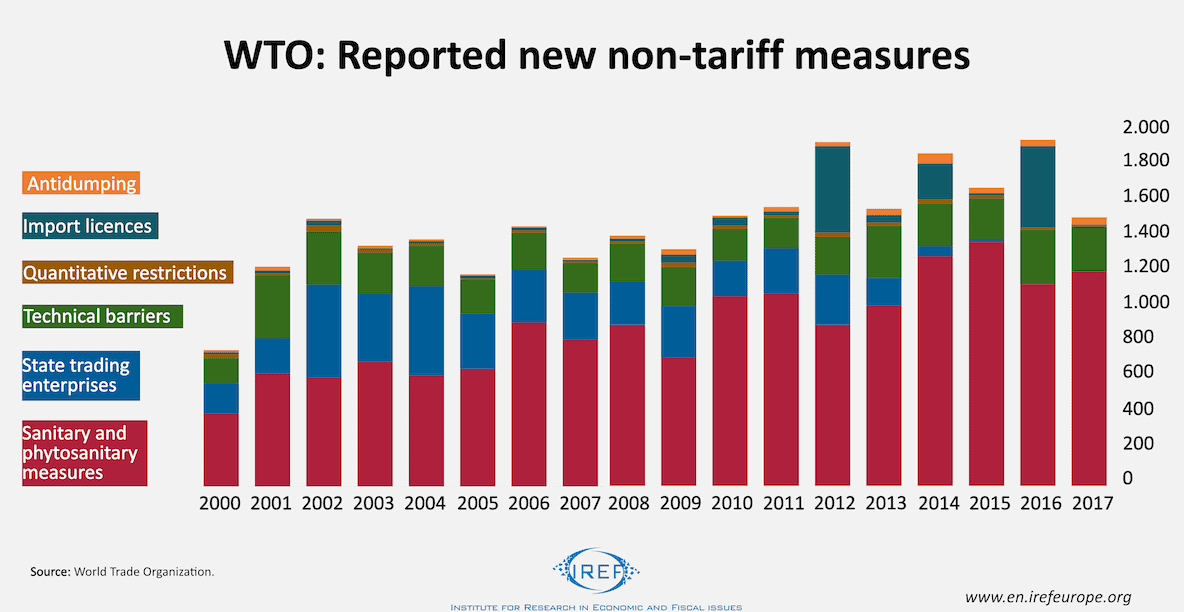
Large, developed countries with robust trade economies can – and do – use such barriers to protect domestic markets, especially with smaller trade partners. Many of these can be seen between large developed geographies as well (e.g., the U.S., China, Brazil, India, and the EU). An additional non-tariff policy could include specific trade exchange policies of disparate products where there is mutual benefit to both trading partners; essentially, ‘I will buy those of your country’s production if you will buy these products of mine.’
I posit that both tariffs and non-tariff policies should be used to protect nascent U.S. industry or a strategically important industry such as advanced silicon chip manufacturing; however, these should be reduced or withdrawn over time to assure the domestic companies do not rely on such protection long term, but rather continue to innovate to compete in both the domestic market and global free trade markets.
Clustering and Innovation Benefits
Porter (2008) concludes that geographical and regional clusters improve products and efficiencies, enable innovation, and facilitate the formation of new businesses and commercialization of new technologies.
When a national environment permits and supports the most rapid accumulation the most rapid accumulation of specialized skills and assets…affords better ongoing information and insight[s]…[and] pressures companies to innovate and invest, companies both gain a competitive advantage and upgrade those advantages over time. (Porter, 1990a, p. 79)
The PV industry, as discussed here, is primarily single crystal wafer-based. It is exposed to change along many of the lines discussed by Porter (1990). New technologies in amorphous silicon exist, however to date, are not currently effective in the market due to both a lack of solar efficiency per square meter and no significant midstream or downstream cost advantages. As this technology, the DC to AC conversion costs, and electrical storage costs improve, all PV manufacturers may need to innovate to survive long term.
Therefore, the U.S. can encourage clustering and derive the inherent benefits by creating defined ‘cluster zones’ at or near existing U.S. PV or silicon related technology clusters. Naturally occurring incentives including access to educated workers could be enhanced by government subsidies such as reduced taxation and export expense, employment credits, reduced green-field costs, or enhanced access to financial capital.
Sophisticated Domestic Demand
Porter’s diamond model indicates that sophisticated domestic market demand is vital to create pressure for companies to continue to innovate and become/remain globally competitive. By creating market incentives such as purchase or energy tax credits, a return to buy American campaigns and/or incentives, access to inexpensive financing and installation, the U.S commercial and private consumption should continue to grow, and these consumers should exhibit normal market forces when an industry has increased consumer power and influence. That is, growing demands in quality, performance, features, and price control.
Endowments
In 2012, Porter reframed competitiveness into three factions:
1.Microeconomic competitiveness – the nation’s business climate, state of cluster development, and quality of companies’ operations and strategies;
2. Macroeconomic competitiveness– national economic policies and a country’s development of human assets and political institutions
3. Endowments – a country’s unique strategic national assets (e.g., human or financial capital) and their effective use.
Other than specific tangible endowments such as transportation infrastructure, the U.S. has a comparative advantage in certain intangible endowments – our skilled workforce and higher education system. To enhance and maintain this advantage, I posit additional investments in both. This includes changes to local, state or institutional policies. For example:
·Enhanced access to higher education including low/no-cost financing for higher education for students from the U.S. and abroad; and improvements in U.S. internet infrastructure to increase distance learning by quality institutions for geographically remote students.
·Increased incentives for U.S. and foreign students to contribute to study for targeted industry applicable degrees (e.g., science, engineering, alternative energy); access for those students to find employment in targeted industries through student and employer incentives; and the ability to retain U.S. trained students in U.S. industries.
·Incentives to retain an educated workforce. For example, similar to U.S. military academies, a degree from a U.S. institution would require the student – foreign or domestic – to live and work within the U.S. for a given period depending on the level of education. Incentives for foreign students to remain working in the U.S. or starting a U.S based business could include extended visa and work privileges.
Free Trade and Fair Trade
Although there is strong support for free trade within the body of literature, the current data does not necessarily reflect a level playing field. This may be due to government interventions, political and economic policies, or a plethora of reasons outside the boundaries of this review.
Upstream manufacturers of silicon or wafers provide a small portion of the overall $150 billion PV market. It has become a commodity and difficult for producers to differentiate. Economies of scale are important , but margins are lower. As Figure 7 also shows, China’s dominance and economies of scale reflect overall lower PV cell and panel costs in this market sector.
Figure 7 Solar PV Cost Trends with Economies of Scale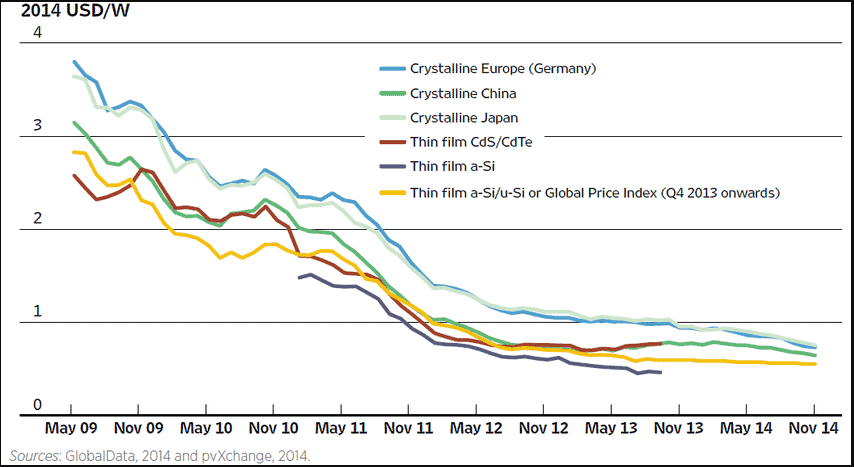
Manufacturers of solar cells and panels also benefit from the economies of scale. In this sector, the U.S. has net negative exports to China (i.e., net imports exceed net exports). The downstream assembly of PV panels and installation of systems constitute the largest market share. Since installation is confined to a local or regional service, only panel manufacturing can be global, although assembly could be distributed regionally, locating nearest key markets to reduce transportation costs. If one views the U.S. assembly and installation maps, this is readily apparent.
Figure 8 U.S. Solar Installation
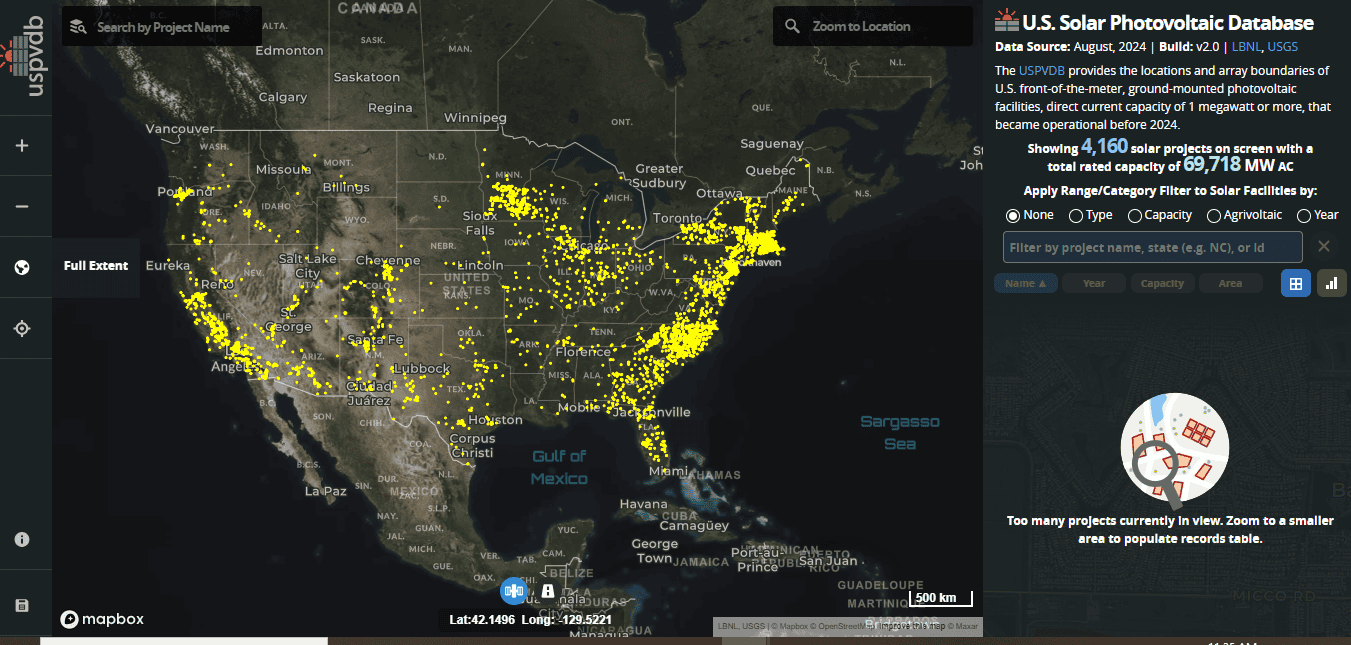
Source: USPVDB Dynamic Database. Retrieved from https://eerscmap.usgs.gov/uspvdb/viewer/#3/37.11/-93.44
If one assumes that each country’s national interests will drive economic and industrial policies (Gomory & Baumal, 2000), then free market dynamics will probably not stabilize. For example, in 2012 the Obama administration applied a 31% import tariff on China wafers and panels to help the nascent U.S. based suppliers (Lee, 2012). In an apparent effort to provide indirect government subsidies to support
As China’s excess wafer and panel capacity as world PV market demand weakened, China’s domestic market consumed 20% of global PV shipments in 2012 (Marketbuzz, 2013). One third was in the last quarter of 2012 outstripping all other countries (Marketbuzz, 2013). Both import tariffs and government subsidies to industries are inconsistent
Based on available data, World PV Market 2009 – 2022 with Porter (1990, 1990a, 2008) and trade theory (Baldwin &Krugman, 1988; Krugman, 1991,1994). Porter’s (1990) diamond model and Krugman’s (1991) New Trade Theory both suggest that “change,” including disruptive political policies or other events, can significantly affect the balance for a stable, efficient free trade market.
Although the overall PV market is projected to grow by 400 to 600 gigawatts (GW) from a 2012 installation base of only 65 GW, costs are projected to continue to drop by as much as 10% per year through 2020. PV prices tend to be set by fossil fuel prices, therefore margins should continue to grow for PV (Aanesen, Heck, and Pinner, 2012). The U.S. PV industry must survive during market and economic downturns to remain sustainable. Therefore, in economic and market downturns, government interventions may again be required both here and abroad.
Summary
The last two parameters of Porter’s diamond model (Porter, 1990) are critical for the U.S. to sustain long term success in the global PV market. Change – dramatic political, market, technological, or other events – is one of these. Another is any major U.S. PV and chip making industries’ disadvantage, such as disruptions in a consistent supply of rare earth resources (i.e., China currently controls 96% of the world supply), a critical processing component required in most silicon based technologies, including PV cell production.
Specifically, I would posit the following five U.S. strategic trade policies for the PV Alternative Energy industry which may apply to other emerging technologies:
1. Strategic Industry Protection
a. Provide limited tariff and non-tariff protection
b. Provide a plan to reduce or eliminate protection
2. Clustering and Innovation Benefits
a. Create regional PV cluster zones
b. Provide cash and non-cash incentives in PV cluster zones
3. Sophisticated Domestic Demand
a. Enhance U.S. market incentives
b. Create alternative energy requirements
4. Secure and invest in Endowments (strategic assets)
a. Invest in Education
b. Policies to retain educated human resources
5. Support free trade concepts, but work to enforce fair trade
The U.S. should continue to support free trade, but develop a fair trade policy and require compliance from trade partners – transparency, labor and environmental standards, dumping restrictions, and compliance with World Trade Organization (WTO) guidelines. This may include reciprocity with mutual access to each trading partner’s domestic markets – which may not always be in the best interests of one or either country. The question becomes, who determines what is fair? Global institutions like the WTO or International Monetary Fund may help but with limited enforceable authority.
This article proposes strategic trade policies for the U.S.; however, Porter warned in 1990,
…there is a growing tendency to experiment with various policies intended to promote national competitiveness – from efforts to manage exchange rates to new measures to manage trade…which usually end up undermining it only. These new approaches…are flawed. They fundamentally misperceive the true sources of competitive advantage. Pursuing them, with all their short-term appeal, will virtually guarantee that the United States…never achieves real and sustainable advantage.
Within the last few years, the U.S. has again established tax credits and subsidized enhanced financing available to commercial and private PV consumers. This is partially a stimulus response to the weak U.S. economy, and under the Obama administration a way to encourage the domestic alternative energy industry. These are not permanent policies, and how long they will last or remain effective is at question.
As of 2010, the Carter White House thermal solar panels were in museums. One is in the Smithsonian, one in the Carter Library, and one in the Solar Science and Technology Museum in China. After thirty years, the U.S. is re-engaging for comparative advantage in PV. PV solar panels are again “sprouting on the Carrizo” (Sneed, 2012, p.1) in California, employing 400 installers and eventually producing 800 megawatts (Sneed, 2012).
With the U.S. success in natural gas fractionation and the current U.S. dominance in oil production, the U.S. consumer and political interests in alternative energy sources may again wane. An analysis of this effect is well beyond the scope of this article. Only time and implementing new policies can defend or contradict the effective use of strategic trade theory.
References for further in-depth research and reading
Aanesen, K., Heck, S. & Pinner, D. (2012). Solar Power: Darkest before the dawn. McKinsey on Sustainability & Resource Productivity.Spring 2012.
Baldwin, R. &Krugman, P. 1988. Industrial Policy and International Competition
in Wide-bodied Jet Aircraft. Trade Policy Issues and Empirical Analysis, R. Baldwin (Ed). Chicago: University of Chicago Press.
Bloomberg.( 2004). Shaking Up Trade Theory. Bloomberg Business Week Magazine. Retrieved from http://www.businessweek.com/stories/2004-12-05/shaking-up-trade-theory
Bloomberg. (2005). Online Extra: The Trade Challenge. Bloomberg Business Week Magazine. Retrieved from http://www.businessweek.com/stories/2005-08-21/online-extra-the-trade-challenge
Chadly, A. a, Moawad, K. b, Salah, K.c, Omar, M.b, Mayyas, A..(2012) WTO (2012).World Trade Report 2012.World Trade Organization, State of global solar energy market: Overview, China’s role, Challenges, and Opportunities Retrieved from Science Direct https://www.sciencedirect.com/science/article/pii/S2772737824000208, Specifically, from http://www.wto.org/english/res_e/booksp_e/anrep_e/world_trade_report12_e.pdf
Davies, H. & Ellis, P. (2000). Porter’s Competitive Advantage of Nations: Time for the final judgement? Journal of Management Studies,37 (8), 1189 – 1213.
DESA (2010).Department of Economic and Social Affairs.United Nations. Retrieved from http://www.un.org/en/development/desa/publications/statistical-yearbook-fifty-second-issue.html
Dixit, A. (1988). Optimal trade and industrial policies for the US automobile industry.Empirical Research in International Trade, R. Feenstra (Ed.). Cambridge: MIT Press
Friedman, T. (2006).The World is Flat: The globalized world in the twenty-first century. London, Penguin Books Ltd.
Furman, J., Porter, M., & Stern, S. (2002). The Determinants of National Innovative Capacity.Research Policy,31, 899-933. Retrieved from www.elsevier.com/locate/econbase.
Gomory, R. &Baumol, W. (2000).Global Trade and Conflicting National Interests.The Quarterly Journal of Australian Economics, 10 (2): 83-92. Retrieved from http://mises.org/journals/qjae/pdf/qjae10_2_6.pdf
Grant, R. (1991). Porter’s ‘Competitive Advantage of Nations’: An assessment. Strategic Management Journal, 12, 535-548.
Hachigian, N. &Sutphen, M. (2008). Strategic Collaboration: How the United States Can Thrive as Other Powers Rise. The Washington Quarterly, 31 (4), 43-57.
Hasana, R., Mitrab, D. Ranjanc, P., &Ahsand, R. (2012). Trade liberalization and unemployment: Theory and evidence from India. Journal of Development Economics, 97 (2), 269-280. Retrieved from http://www.sciencedirect.com.catalog.georgefox.edu/science/article/pii/S0304387811000332
Hejazi, W. (2009). Does China Receive More Regional FDI than Gravity Would Suggest? European Management Journal, 27, 327-335. Retrieved from www.elsevier.com/locate/emj
Kaftan, C. (2013).US Leads China in Solar Exports.PV Magazine, March 7, 2013. Retrieved from http://www.pv-magazine.com/news/details/beitrag/us-leads-china-in-solar-exports_100010480/#axzz2PTX4JSgx
Krugman, P. (1994) Introduction to Empirical Studies of Strategic Trade Policy. In P. Krugman (Ed.) & A. Smith (Ed.) Empirical Studies of Strategic Trade Policy. pp. 1-10. Chicago: University of Chicago Press. Retrieved from http://www.nber.org/chapters/c8673.pdfhttp://www.nber.org/chapters/c8673.pdf
Krugman, P. (1991). Increasing Returns and Economic Geography.Journal of Political Economy, 99,(3), Retrieved from http://www.jstor.org/discover/10.2307/2937739?uid=2&uid=4&sid=21102065140827
Krugman, P. (2008). The Conscience of a Liberal.The New York Times,Th Opinion Pages, October 15.
Retrieved from http://krugman.blogs.nytimes.com/2008/10/15/about-the-work/
Kynge, J. (2006). China Shakes the World: A titan’s rise and troubled future – and thechallenge for America. New York, NY: Houghton Mifflin Company
Lee, D. (2012). U.S. Orders Tariffs on Chinese Solar Panels. Los Angeles Times, May 18, 2012. Retrieved from http://articles.latimes.com/2012/may/18/business/la-fi-china-solar-dumping-20120518
Luo, Y., Sun, J., & Wang, S. (2011). Comparative strategic management: An emergent field in international management. Journal of International Management,17,190-200.
Meredith, R. (2007). The Elephant and the Dragon. New York: W.W. Norton & Company.
PIDA (2012). Analysis of Solar Industry in the Globe, Photonics Industry& Technology Development Association. Retrieved from http://spie.org/exhibitordirectory/company/Photonics-Industry-AND-Technology-Development-Association-(PIDA)-Taipei-
Porter, M. (1986).Changing Patterns of International Competition.California Management Review, XXVIII, (2)
Porter, M. (1990).The Competitive Advantage of Nations. New York: Free Press
Porter, M. (1990a). The Competitive Advantage of Nations.Harvard Business Review. March-April 1990, pp. 73-91.
Porter, M. & Millar, V. (2001). How Information Gives You Competitive Advantage. Harvard Business Review, July-August, 149-174.
Porter, M. (2008). Clusters, Innovation, and Competitiveness: New findings and implications for policy. Presentation in Stockholm, Sweden, January 22, 2008.Retrieved from www.isc.hbs.edu
Porter, M. (2012).Regional Competitiveness and the Role of Business.Presentation in Sintonia, Puebla, Mexico, April 27, 2012. Retrieved from www.isc.hbs.edu
Porter, M. (n.d.).Competition and Economic Development.(n.d,). Institute for Strategy and Competitiveness. M. Porter (ed.). Retrieved from http://www.isc.hbs.edu/econ-natlcomp.htm
Rugman, A. &Verbeke, A. (1993). Foreign Subsidiaries and Multinational Strategic Management: An extension and correction of Porter’s diamond framework. Management International Review, 33, 71-84.
Rugman, A. (2009). Is International Business Strategy Global or Regional? European Management Journal, 27, 293-294. Retrieved from www.elsevier.com/locate/emj
Ryu, J. & Simpson, J. (2011). Retail Internationalization: Lessons from “big three” global retailers’ failure cases. Journal of Business and Retail Management Research, 6 (1).
Samuelson, Paul A. (2004). Where Ricardo and Mill Rebut and Confirm Arguments of Mainstream Economists Supporting Globalization.Journal of Economic Perspectives.Summer 18, 135–46.
Samuelson, P. (2005).Where Ricardo and Mill Rebut and Confirm Arguments of Mainstream Economists Supporting Globalization Response.Journal of Economic Perspectives, 19 (3), 242-244. Retrieved from http://0-web.ebscohost.com.catalog.georgefox.edu/ehost/detail?sid=f97756ea-f473-4bde-98d8-29ef4aef54c3%40sessionmgr114&vid=4&hid=128&bdata=JnNjb3BlPXNpdGU%3d#db=bth&AN=23454925
Smit, A. (2010). The Competitive Advantage of Nations: is Porter’s diamond framework a new theory that explains the international competitiveness of countries? South African Business Review,14 (1), 105-130.
Sneed, D. (2012). Solar Panels Sprouting on the Carizzo.The Tribune, February 4, 2012. Retrieved from http://www.sanluisobispo.com/2012/02/04/1935825/solar-panels-carrizo-plains.html
Solarbuzz (2010).Global PV Market.Solarbuzz: Solar Market Research and Analysis. Retrieved from http://www.solarbuzz.com/facts-and-figures/market-facts/global-pv-market
Sraffa, P.(1951)In The Works and Correspondence of David Ricardo, Vol 1, ed. Sraffa, P. Cambridge: Cambridge University Press, 1951
Stone, H. &Ranchod, A. (2006).Competitive advantage of a Nation in the Global Arena: A quantitative advancement to Porter’s diamond applied to the UK, USA and BRIC nations. Strategic Change, 15, 283-294.doi: 10.1002/jsc.770. Retrieved from www.interscience.wiley.com
Su, Y. (2013). Competing in the Global Solar Photovoltaic Industry: The case of Taiwan.International Journal of Photoenergy, Vol. 2013, Retrieved from http://www.hindawi.com/journals/ijp/2013/794367/
Wood McKenzie online (07 November 2023) China to hold over 80% of global solar manufacturing capacity from 2023-26. Retrieved from https://www.woodmac.com/press-releases/china-dominance-on-global-solar-supply-chain/
World Economic Forum. (2012). The Global Competitiveness Index 2012-2013: Country profile highlights. Schwab, K. (ed.), Retrieved from http://www.weforum.org/issues/global-competitiveness
I do trust all the ideas youve presented in your post They are really convincing and will definitely work Nonetheless the posts are too short for newbies May just you please lengthen them a bit from next time Thank you for the post
Hahaha! I’m surprised you think my posts are too short LOL. Most find them a bit TOO detailed, but thanks for the comment.
Your ability to distill complex concepts into digestible nuggets of wisdom is truly remarkable. I always come away from your blog feeling enlightened and inspired. Keep up the phenomenal work!
Wow! Your comment really touches my heart. Glad you enjoy this diverse set of Research Rants 🙂
I do not even understand how I ended up here, but I assumed this publish used to be great
For the reason that the admin of this site is working, no uncertainty very quickly it will be renowned, due to its quality contents.
I am truly thankful to the owner of this web site who has shared this fantastic piece of writing at at this place.
Good post! We will be linking to this particularly great post on our site. Keep up the great writing
Üsküdar su kaçağı hizmetleri Su faturam çok yüksekti, Üsküdar ekibi sorunu hemen tespit etti. Teşekkürler! http://castingpal.com/read-blog/4848
Your point of view caught my eye and was very interesting. Thanks. I have a question for you. https://accounts.binance.com/ru/register?ref=V3MG69RO
Ümraniye süpürge bakım kampanya Süpürgem artık ilk günkü gibi çalışıyor! http://aca124.ru/question/elektrikli-supurge-tamircisi/
Thank you for your sharing. I am worried that I lack creative ideas. It is your article that makes me full of hope. Thank you. But, I have a question, can you help me?
Your point of view caught my eye and was very interesting. Thanks. I have a question for you.
Simply wish to say your article is as amazing The clearness in your post is just nice and i could assume youre an expert on this subject Well with your permission let me to grab your feed to keep updated with forthcoming post Thanks a million and please carry on the gratifying work
I do trust all the ideas youve presented in your post They are really convincing and will definitely work Nonetheless the posts are too short for newbies May just you please lengthen them a bit from next time Thank you for the post
My brother recommended I might like this web site He was totally right This post actually made my day You cannt imagine just how much time I had spent for this information Thanks
Your blog is a testament to your dedication to your craft. Your commitment to excellence is evident in every aspect of your writing. Thank you for being such a positive influence in the online community.
“I agree with your points, very insightful!”
I was recommended this website by my cousin I am not sure whether this post is written by him as nobody else know such detailed about my trouble You are amazing Thanks
Can you be more specific about the content of your article? After reading it, I still have some doubts. Hope you can help me.
Thanks for sharing. I read many of your blog posts, cool, your blog is very good.
Thank you for your sharing. I am worried that I lack creative ideas. It is your article that makes me full of hope. Thank you. But, I have a question, can you help me?
Your point of view caught my eye and was very interesting. Thanks. I have a question for you.
Your point of view caught my eye and was very interesting. Thanks. I have a question for you.
Göktürk su kaçak tespiti Kaliteli Ekipmanlar: “Kullandıkları cihazlar oldukça profesyoneldi. Sorun tespiti hızlı ve temiz oldu. https://wutdawut.com/ustaelektrikci
Thank you for your sharing. I am worried that I lack creative ideas. It is your article that makes me full of hope. Thank you. But, I have a question, can you help me?
¡Hola a todos!
Estuve mucho tiempo reflexionando sobre cómo mejorar los parámetros de Ahrefs, Domain Rank, el sitio y mis proyectos y descubrí >>>
El spam en foros con Xrumer es una forma eficaz de posicionarse en los motores de búsqueda. El envío de enlaces a través de foros mejora los indicadores SEO en poco tiempo. La automatización del link building ahorra tiempo y energía. El aumento de la masa de enlaces conduce al crecimiento del DR y Ahrefs. Usa Xrumer para crear enlaces externos de calidad.
Encontré a unos chicos geniales, desarrollaron un envío barato y, lo más importante, productivo con Xrumer – https://ya.ru/search/?text=%D1%82%D0%B0%D1%80%D0%B8%D1%84+bullet&lr=2
Uso de Xrumer en campaГ±as SEO
Xrumer: configuraciГіn para SEO
CreaciГіn de enlaces con programas automГЎticos
ColocaciГіn automГЎtica de enlaces
https://hostfrost.site/
¡Mucho éxito y crecimiento en los rankings!
096FF12F662B80BFAC5039F02B44FAAD
6a7u7v
Thank you for your sharing. I am worried that I lack creative ideas. It is your article that makes me full of hope. Thank you. But, I have a question, can you help me?
Enjoyed looking through this, very good stuff, appreciate it. “Golf isn’t a game, it’s a choice that one makes with one’s life.” by Charles Rosin.
Can you be more specific about the content of your article? After reading it, I still have some doubts. Hope you can help me.
I don’t think the title of your article matches the content lol. Just kidding, mainly because I had some doubts after reading the article.
Thank you for your sharing. I am worried that I lack creative ideas. It is your article that makes me full of hope. Thank you. But, I have a question, can you help me? https://www.binance.com/es-MX/register?ref=JHQQKNKN
Thank you for your sharing. I am worried that I lack creative ideas. It is your article that makes me full of hope. Thank you. But, I have a question, can you help me? https://www.binance.com/sl/register?ref=PORL8W0Z
Your article helped me a lot, is there any more related content? Thanks!
Can you be more specific about the content of your article? After reading it, I still have some doubts. Hope you can help me. https://accounts.binance.com/bn/register?ref=UM6SMJM3
Thank you for your sharing. I am worried that I lack creative ideas. It is your article that makes me full of hope. Thank you. But, I have a question, can you help me?
I don’t think the title of your article matches the content lol. Just kidding, mainly because I had some doubts after reading the article.
Your article helped me a lot, is there any more related content? Thanks!
Thank you for your sharing. I am worried that I lack creative ideas. It is your article that makes me full of hope. Thank you. But, I have a question, can you help me?
Can you be more specific about the content of your article? After reading it, I still have some doubts. Hope you can help me.
Your point of view caught my eye and was very interesting. Thanks. I have a question for you.
Can you be more specific about the content of your article? After reading it, I still have some doubts. Hope you can help me.
Uğurmumcu su kaçak tespiti Ekibin kullandığı termal kameralar sayesinde kaçağın yerini nokta atışıyla buldular. https://guard-xpress.com/author/kacak/
Thanks for sharing. I read many of your blog posts, cool, your blog is very good.
Can you be more specific about the content of your article? After reading it, I still have some doubts. Hope you can help me.
Can you be more specific about the content of your article? After reading it, I still have some doubts. Hope you can help me.
I don’t think the title of your article matches the content lol. Just kidding, mainly because I had some doubts after reading the article.
Thanks for sharing. I read many of your blog posts, cool, your blog is very good.
I don’t think the title of your article matches the content lol. Just kidding, mainly because I had some doubts after reading the article.
Your point of view caught my eye and was very interesting. Thanks. I have a question for you.
Your point of view caught my eye and was very interesting. Thanks. I have a question for you.
Thanks for sharing. I read many of your blog posts, cool, your blog is very good.
9v7xa7
Your article helped me a lot, is there any more related content? Thanks!
36ejvf
Can you be more specific about the content of your article? After reading it, I still have some doubts. Hope you can help me.
This web site is really a walk-through for all of the info you wanted about this and didn’t know who to ask. Glimpse here, and you’ll definitely discover it.
Your article helped me a lot, is there any more related content? Thanks!
Thanks for sharing. I read many of your blog posts, cool, your blog is very good.
Thank you for your sharing. I am worried that I lack creative ideas. It is your article that makes me full of hope. Thank you. But, I have a question, can you help me?
Can you be more specific about the content of your article? After reading it, I still have some doubts. Hope you can help me.
Your article helped me a lot, is there any more related content? Thanks!
I don’t think the title of your article matches the content lol. Just kidding, mainly because I had some doubts after reading the article.
I don’t think the title of your article matches the content lol. Just kidding, mainly because I had some doubts after reading the article. https://www.binance.com/ru/register?ref=V3MG69RO
Хотите учиться легче и продуктивнее?
Полезные советы для студентов — на этом сайте
Your article helped me a lot, is there any more related content? Thanks!
Can you be more specific about the content of your article? After reading it, I still have some doubts. Hope you can help me.
Can you be more specific about the content of your article? After reading it, I still have some doubts. Hope you can help me.
Thanks for sharing. I read many of your blog posts, cool, your blog is very good.
Your point of view caught my eye and was very interesting. Thanks. I have a question for you.
Thanks for sharing. I read many of your blog posts, cool, your blog is very good.
İstanbul kırmadan su kaçak bulma Beylikdüzü’ndeki evimizdeki su kaçağını bulmaları çok zordu, ama çok başarılı oldular. http://1stchoiceofficefurniture.co.uk/?p=1700
qHyTKyV aPvzcTG ofLGN GODoQfzx
Sancaktepe su kaçak tespiti Çatalca su kaçağı tespiti: Çatalca’da su kaçakları için güvenilir çözüm. https://devinfos.net/?p=22035
Can you be more specific about the content of your article? After reading it, I still have some doubts. Hope you can help me.
Thank you for every other informative website. The place else may just I am getting that type of information written in such a perfect method? I’ve a undertaking that I’m simply now operating on, and I have been on the glance out for such information.
vuycq3
Thank you for your sharing. I am worried that I lack creative ideas. It is your article that makes me full of hope. Thank you. But, I have a question, can you help me?
Can you be more specific about the content of your article? After reading it, I still have some doubts. Hope you can help me.
Thank you for your sharing. I am worried that I lack creative ideas. It is your article that makes me full of hope. Thank you. But, I have a question, can you help me?
Can you be more specific about the content of your article? After reading it, I still have some doubts. Hope you can help me.
Your article helped me a lot, is there any more related content? Thanks!
smxzx5
uia61r
Can you be more specific about the content of your article? After reading it, I still have some doubts. Hope you can help me.
Thank you for your sharing. I am worried that I lack creative ideas. It is your article that makes me full of hope. Thank you. But, I have a question, can you help me?
Thanks for sharing. I read many of your blog posts, cool, your blog is very good.
Thanks for sharing. I read many of your blog posts, cool, your blog is very good.
I think this internet site has some real excellent information for everyone. “Je veux que les paysans mettent la poule au pot tous les dimanches.” by King Henry IV of France.
rhdrch
I appreciate, cause I found just what I was looking for. You’ve ended my 4 day long hunt! God Bless you man. Have a nice day. Bye
I don’t think the title of your article matches the content lol. Just kidding, mainly because I had some doubts after reading the article. https://www.binance.com/fr/register?ref=GJY4VW8W
I don’t think the title of your article matches the content lol. Just kidding, mainly because I had some doubts after reading the article.
I don’t think the title of your article matches the content lol. Just kidding, mainly because I had some doubts after reading the article.