by Dr Jonathan Cooley
National Debt is money the US government owes to individuals, corporations, government entities and foreign investors.
It’s like our family debt, isn’t it? Like affording a home or a car? We have debts that are due monthly and we can only afford as much as our income allows given all our other expenses. So isn’t the government the same?
I keep hearing this (again) from Congresspeople…
“No” is the short answer.
In 2012, a Noble Prize winner in economics, Dr. Paul Krugman finished an Op-Ed piece called Nobody Understands Debt1 (New York Times, January 1, 2012). Not much has changed in the overall scheme with today’s “Debt Crisis” fostered by certain Republicans who don’t want to extend the Debt ceiling or wish to use it as leverage for their other goals. And here we are again in 2023, so this discussion is relevant.
Dr. Krugman states,
“…through most of 2011, as in 2010, almost all the conversation in Washington was about something else: the allegedly urgent issue of reducing the budget deficit.”
He continues,
“This misplaced focus said a lot about our political culture, in particular about how disconnected Congress is from the suffering of ordinary Americans. But it also revealed something else: when people in D.C. talk about deficits and debt, by and large they have no idea what they’re talking about… while debt can be a problem, the way our politicians and pundits think about debt is all wrong, and exaggerates the problem’s size… They see America as being like a family that took out too large a mortgage, and will have a hard time making the monthly payments.”
This is, however, a really bad analogy in at least two ways.
More importantly to me, Krugman notes,
“First, families have to pay back their debt. Governments don’t — all they need to do is ensure that debt grows more slowly than their tax base. …1“
To begin, here is a chart that helps put US sources (income) and uses (how we spend money) in perspective.
Chart 1: US Sources (income) and Uses (expenditures) 2
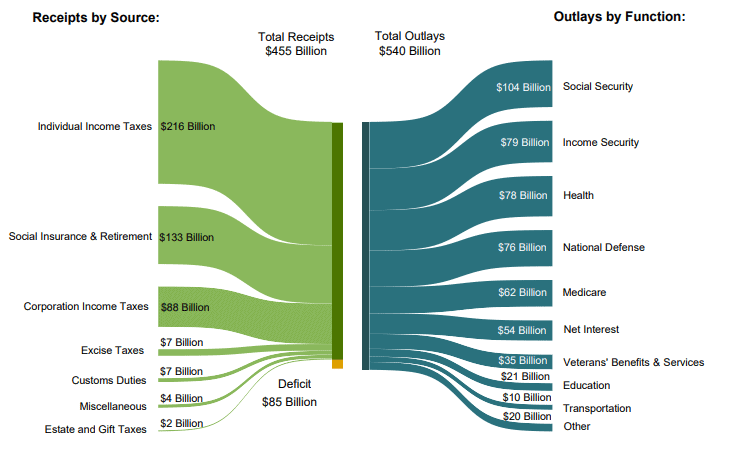
Source: https://www.fiscal.treasury.gov/files/reports-statements/mts/mts1222.pdf
First, we will discuss the National Deficit. Then we will add the National Debt to the conversation.
National Deficit: The National Deficit is the difference between our national income from taxes and other sources and what our government spends. Although it fluctuates, the Congressional Budget Office (CBO) indicates it has generally been rising from a surplus of $236 billion under President Clinton to a projected debt of $1.0 trillion in 2023.
For example, the US National Deficit in 2010 was 10.7% of GDP while Norway had a SURPLUS of 9.9%. Here is a chart of the US history since 1900. 14 Listening to some current economic historians (e.g., Niall Ferguson, Empires on the Edge of Chaos 2), National Debt as a percent of GDP (US Gross Domestic Product) and National Debt as a percent of average personal income may be more critical than National Deficit. If we look to history and modern India, China, Greece and Italy where dramatic debt has been experienced there may be more lessons to be learned, but these are beyond the scope of this article.
US National Debt as a percent of GDP grew rapidly rose above 45% of GDP as a result of World War I and above 70 % in the depths of the Great Depression. Debt has breached 100% of GDP twice since 1900: during World War II and in the aftermath of the Crash of 2008 3. Krugman points out, debt from World War II was never repaid; it just became increasingly irrelevant as the US economy and tax base grew.
Chart 2: US National Deficit as a % of GDP, 1900 to 2015
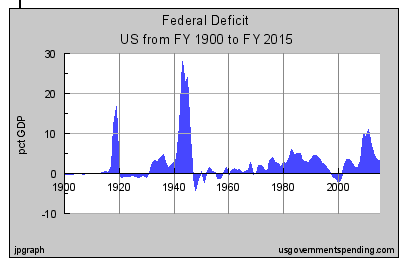
Do you find this chart surprising? I did.
I didn’t try to match it to economic policy or Democratic/Republican control of the presidency or congress – but that might also be interesting and enlightening.
Below is a brief history since the 2016 President Trump administration.
US National Debt Deficit since 2016
- 2016: $585 billion deficit – Trump elected to office
- 2017: $666 billion deficit (13.8% INCREASE)
- 2018: $779 billion deficit (17% INCREASE)
- 2019: $984 billion deficit (26.3% INCREASE)
- Total INCREASE of 68.2%
- 2020: $3.1 trillion deficit – Byden elected to office
- 2021: $2.2 trillion deficit (projected -29% DECREASE)
- 2022: $1.1 trillion deficit (projected -50% DECREASE)
- 2023: $1.0 trillion deficit (projected -0.9% DECREASE
- Total = Time will tell
Here are some references for this information:
- Congressional Budget Office. “The Budget and Economic Outlook: 2021 to 2031.” February 2021.
- Congressional Budget Office. “Monthly BudgetReview: January 2021.” January 2021.
The National Debt
Top of Form
The US National Debt – not to be confused with the US National Deficit discussed earlier – is the total amount of money borrowed from different sources and upon which the US is paying interest.
So how is the United States doing now?
Taxes increase as companies pay based on taxable profits and citizens pay based on taxable income. Krugman indicated that all governments need to do is ensure that debt grows more slowly than their tax base. So how is our tax base and how does it compare to other countries such as China?
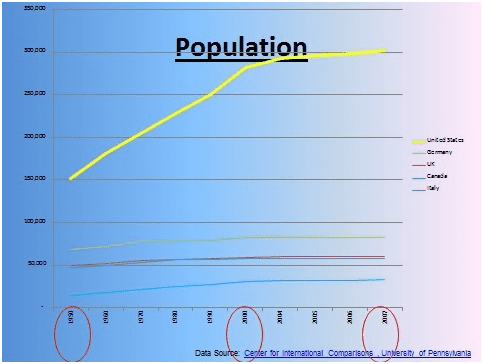
Population and the Tax Base: First, let’s consider taxable citizens and population growth. We had a large growth in population after WWII (the “baby boom”) which provided an ever-increasing taxable population. It has since basically leveled off. Note the massive growth since 1950 (yellow line) compared to Canada, Germany , Italy and the UK .
Chart 3 US Population Growth (US is Yellow line)
When compared to China the chart looks like this (US is still the Yellow line, China is the Red line) 4;
Chart 4: China Population Growth (US is Yellow line; China is the Red line)
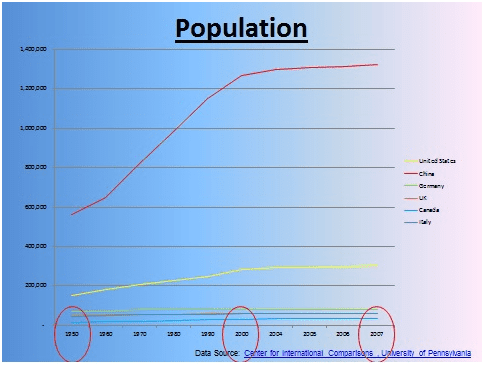
Look familiar? China’s population growth was similar, just more massive. Even with a different personal tax structure than the US, China recognized a growth in income.
Recent reports now indicate US and Chinese birth rates are falling and have dropped to the lowest level since national data have been available and the number of working adults who pay taxes is also falling as a percent of total population.
As of 2023 in the US, birth rates have been declining for several years. According to the Centers for Disease Control and Prevention (CDC), the general fertility rate in the US was 55.8 births per 1,000 women aged 15-44 in 2020, a record low. Births also fell by 4% in 2020, reaching the lowest level since 1979. Source: https://www.cdc.gov/nchs/pressroom/nchs_press_releases/2021/20210721.htm
In China, the birth rate has also been declining, with record low births in 2020. According to China’s National Bureau of Statistics, births dropped 18.1% in 2020, down from 2019. The Chinese government is now encouraging couples to have more children, but these efforts have not yet resulted in an increase in the birth rate. Source: http://www.stats.gov.cn/english/PressRelease/202101/t20210118_1814695.html
The US also had larger proportions of people in older age groups – 65 or older and 80 or older than much of the rest of the world in 2000. 6, 7 And older age groups typically do not contribute to the tax base and governments may actually spend money on them for programs such as Social Security or Medicare. Although this article focuses on the US and China as examples, we know this trend is also true in Japan, Italy, Germany, and South Korea. China’s dropping birth rates portend of similar dynamics.
Looking at these trends graphically is much easier for me. Here are population pyramids for the US, China and India; India’s population exceeded China’s in 2023.
Chart 5: Population Pyramids for the US, China and India
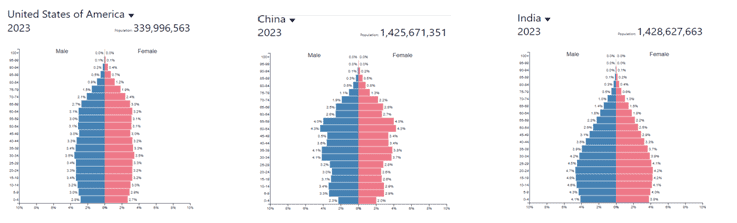
Why is this important? If a large part of China’s economy is based on inexpensive labor and that labor force is shrinking, the country’s tax base is shrinking, and costs for any elderly care would increase. India may now be positioned to provide a competitive workforce attracting the large multi-nationals currently outsourcing to China. How will China react? A contemporaneous article about Dr. Krugman’s article posits that employment is a key governmental concern. Yes! That is the point here. But the US employment rate is now under 4% and may be for some time to come without a major recession. Here is a link to a counter opinion Forbes article by Steve Keen back in 2015 at https://www.forbes.com/sites/stevekeen/2015/02/10/nobody-understands-debt-including-paul-krugman/?sh=33e5f1811ac3 . But again…a topic for another writing.
Globalization: Next, let’s consider globalization. When we combine these drops in a tax paying population with globalizing US multi-nationals where we do not collect foreign profit taxation to recapture US tax income, there is a threat to the tax base that made World War II and Great Depression debt levels appear irrelevant.
To Dr. Krugman’s second main point,
“Second — and this is the point almost nobody seems to get — an over-borrowed family owes money to someone else; US debt is, to a large extent, money we owe to ourselves.”
As he notes, this was true of World War II debt as the US public purchased massive quantities of Treasury Bonds (known as “War Bonds” and “Savings Bonds”). He argues that this debt was significantly bigger, as a percentage of GDP than debt today.
We have only a view backward to the past, each with our own interpretation of the facts.
At the beginning of the 20th century, government debt was equally divided between federal and state debt and local debt, totaling less than 20% of GDP. After World War I, the total debt surged to 45% of GDP. By the mid-1920s debt had declined to below 35% of GDP.
Then came the Great Depression, boosting total public debt to 70 % of GDP. World War II boosted federal debt to almost 122%of GDP in 1946 with state and local debt adding another 7% for a total of 129%. For the next 35 years, the government brought the debt below 50 % of GDP, but President Reagan increased the federal debt by over 50% of GDP, and total debt towards 70% to win the Cold War.
President Bush increased the debt to fight a war on terror and bail out the banks in the crisis of 2008, jumping to 74% of GDP. Debt jumped again during the Obama presidency (2009-2017), increasing 87%, to fund the great Stimulus Package authorized under the Bush administration following the 2008 US financial crisis and recession, as well as increased spending on healthcare, education, and other social programs.. As of December 31, 2011, it stood at 99.7% of GDP..8 and 9
During the Trump presidency (2016-2020), National Debt again increased 68% to $28.2 trillion. This increase was largely driven by the Tax Cuts and Jobs Act of 2017, increased military spending, and COVID-19 relief and additional stimulus spending.
During the current presidency of Joe Biden (2021-present), the National Debt has continued to increase, although it’s important to note that he has only been in office for a relatively short time as of this article. As of September 2021, the National Debt was approximately $28.7 trillion, an increase of 1.8% since Biden took office in January 2021. While projections suggest a decrease in the National Debt, the Biden administration has also passed significant spending increases on infrastructure, healthcare, education, and other social programs that could contribute to further National Debt increases in the future.
Here are some references for this information:
- https://www.thebalancemoney.com/us-debt-by-president-by-dollar-and-percent-3306296
- Congressional Budget Office. “The Budget and Economic Outlook: 2021 to 2031.” February 2021.
- Committee for a Responsible Federal Budget. “Analysis of the President’s FY2022 Budget.” June 2021.
Top of Form
It seems a core of Dr. Krugman’s article says,
“… debt didn’t make postwar America [U.S.] poorer. In particular, the debt didn’t prevent the postwar generation from experiencing the biggest rise in incomes and living standards in our nation’s history.”
But isn’t this time different? Not as much as you think.
It’s true that foreigners now hold large claims on the United States, including a fair amount of government debt. But every dollar’s worth of foreign claims on America is matched by 89 cents’ worth of US claims on foreigners.”
How does this relate country by country such as the US and China? Which countries can we watch to see the effects of high debt as a percent of GDP? In an interesting article from 2007 10, Japan owned the most U.S national debt at $644 Billion followed by China at $350 Billion. A few short years later, China topped the chart at $1,134 Billion with Japan a close second at $979 Billion. 11 Today, Japan again holds the most US Debt.
Which US agencies own the most Treasuries? Social Security, by a long shot. Here’s the breakdown from February 2021:
- 32% Social Security trusts, including the Federal Old-Age and Survivors Insurance and Federal Disability Insurance Trust Funds: $2.90 trillion
- 3.6% Office of Personnel Management Retirement: $955.1 billion
- 3.6% Military Retirement Fund: $1.01 trillion. This has become a big issue in funding our nation’s defense and is only expected to grow.
- 2.5% Cash on hand to fund federal government operations: $723 billion2
- 1.1% Medicare, which includes the Federal Supplementary Medical Insurance Trust Fund: $304.4 billion
The Treasury breaks down who holds how much of the National Debt in the monthly Treasury Bulletin. Here are highlights from the March 2021 report (September 2020 data unless indicated otherwise):
Here’s a summary table I put together and found interesting (2012 and 2022).
Who Holds US National Debt?
12 Source: https://fiscal.treasury.gov/reports-statements/treasury-bulletin/current.html
In Summary, who owns US National Debt ? (Note: Does not total 100% due to rounding)
- 28% Foreign: $7.07 trillion (in September 2020, Japan owned $1.28 trillion and China owned $1.06 trillion of US debt, which is more than a third of foreign holdings)3
- 42% Federal Reserve and Government: $10.81 trillion (December 2020)
- 14% Mutual Funds: $3.5 trillion
- 4% State and Local Governments, including their pension funds: $1.09 trillion
- 3% Private Pension Funds: $784 billion
- 1% Insurance companies: $253 billion
- 1% US Savings Bonds: $147 billion (December 2020)
- 9% Other Holders, including individuals, government-sponsored enterprises, brokers and dealers, banks, bank personal trusts and estates, corporate and non-corporate businesses, and other investors: $2.28 trillion4”
Source: https://www.thebalance.com/who-owns-the-u-s-national-debt-3306124
Historical US Debt https://treasurydirect.gov/govt/reports/pd/histdebt/histdebt.htm
So – to my untrained and evening news consumption surprise – US interests do still hold about 65% of the National Debt with China and Japan only holding 6% each.
Dr. Krugman asserts that foreigners tend to put their investments into safe, low-yield assets, which represent US government debt instruments. Although this seems reasonable (even given our drop in credit rating), his article further asserts,
America actually earns more from its assets abroad than it pays to foreign investors. If your image is of a nation that’s already deep in hock to the Chinese, you’ve been misinformed. Nor are we heading rapidly in that direction.”
On balance, Dr. Krugman states,
“Now, the fact …. doesn’t mean that the debt is harmless. Taxes must be levied to pay the interest, and you don’t have to be a right-wing ideologue to concede that taxes impose some cost on the economy, if nothing else by causing a diversion of resources away from productive activities into tax avoidance and evasion. But these costs are a lot less dramatic than the analogy with an over indebted family might suggest… that is, governments that are willing to impose modestly higher taxes when the situation warrants it — have historically been able to live with much higher levels of debt than today’s conventional wisdom would lead you to believe. Britain, in particular, has had debt exceeding 100 % of GDP for 81 of the last 170 years. When Keynes was writing about the need to spend your way out of a depression, Britain was deeper in debt than any advanced nation today, with the exception of Japan.”
Which “debt” is Dr. Krugmen now referring to? National Debt? Total Debt? National Deficit?
The statement refers to the National Debt of the UK. It includes both internal debt (owed to UK residents and institutions) and external debt (owed to foreign creditors).
According to data from the Office for National Statistics, the UK’s national debt as a percentage of GDP has exceeded 100% in recent years, reaching a peak of 107.6% in the first quarter of 2021.19, 20, 21
Conclusion
Finally, Dr. Krugman writes,
“So yes, debt matters. But right now, other things matter more. We need more, not less, government spending to get us out of our unemployment trap. And the wrongheaded ill-informed obsession with debt is standing in the way.”
What does the future hold? Who knows? But it’s important for the public and policy makers to have these facts in perspective.
History teaches us that economic experts have often been wrong. Dr. Krugman recognizes this as well. Forbes publish a counter opinion by Steve Keen back in 2015 at https://www.forbes.com/sites/stevekeen/2015/02/10/nobody-understands-debt-including-paul-krugman/?sh=33e5f1811ac3 . But again…a topic for another writing.
A lesson I learned many years ago from Eli Goldratt17 {The Goal, 1984} and Darrell Huff (How to Lie with Statistics, 1954) 18 and others, is paraphrased as…
Don’t waste time exploring a smart person’s logic. Logic is often perfect.
Question the assumptions and sources upon which the logic is based.
When I ask the Brits how their roads, schools and medical systems are doing today, I get a dark picture – admittedly anecdotal.
Please don’t get me wrong. I like Dr. Paul Krugman and dissenting voices as well. This discussion is neither about economists nor any wrongheaded, ill-informed obsessions. This discussion, the arguments, and the theory dynamics are critical to finding America’s voice with Congress and Voters setting policies that work.
Those people “in the know” propose an argument and a position, but need to provide the reader and listener the courtesy of the source of their assumptions. Then I could use factcheck.com less and, in my opinion, would add credence and discipline to the discussion.
In the statistics used, I have attempted to provide the sources so readers can now pursue their own spin from the sources and statistics, and then it’s up to you and our government representatives, op-eds, and public discourse to suss it out.
Yes, I know there is a limited amount of space for an OpEd. I have gone overboard with references to make a point…references may take space but are important.
Definitions:
This can all be confusing, so here are some definitions:
GDP: Gross Domestic Product is a measure of the total value of goods and services produced within a country’s borders over a specific period of time, usually a year. It is often used to gauge the size and health of an economy. GDP is calculated by adding up the value of all final goods and services produced within a country’s borders, including those produced by foreign-owned firms, but excluding the value of intermediate goods and services (i.e., goods and services used in the production of other goods and services).
National Debt: The sum of all previously incurred annual federal deficits. Since the deficits are financed by government borrowing, national debt is equal to all government debt outstanding. Deficits increased significantly in recent years, particularly in 2020 due to the COVID-19 pandemic, tax reductions, and stimulus spending.
Public Debt: Often used for National Debt. The cumulative total of all government borrowings less repayments that are denominated in a country’s home currency. Public debt should not be confused with external debt.
Government Debt: Also often used for National Debt or Public Debt
External Debt: a measure of a nation’s foreign liabilities, capital plus interest that the government and institutions within a nation’s borders must eventually pay. This number not only includes government debt, but also debt owed by corporations and individuals to entities outside their home country.
*Other Sources:
1 “Nobody Understands Debt” New York Times, January 1, 2012
2 http://fora.tv/2010/07/28/Niall_Ferguson_Empires_on_the_Edge_of_Chaos Ferguson, Niall. & Centre for Independent Studies (Australia). (2010). Empires on the edge of chaos : the nasty fiscal arithmetic of imperial decline. St Leonards, N.S.W : Centre for Independent Studies
3 https://www.fiscal.treasury.gov/files/reports-statements/mts/mts1222.pdf
http://www.usgovernmentspending.com/us_national_debt_chart.html
4 Center for International Comparisons, University of Pennsylvania
5 US Birth Rate Hits All-Time Low, usgovinfo.about.com/cs/censusstatistic/a/aabirthrate.html
6 usgovinfor.about.com
7 http://nationalatlas.gov/articles/people/a_international.html
8 http://www.usgovernmentspending.com/us_national_debt_chart.html
9 http://www.skymachines.com/US-National-Debt-Per-Capita-Percent-of-GDP-and-by-
10 http://www.msnbc.msn.com/id/17424874/ns/business-answer_desk/t/just-who-owns-
us-national-debt/#.TwSoT9T2ZYg
11 2011: http://www.treasury.gov/resource-center/data-chart-center/tic/Documents/mfh.txt
12 Paul Toscano, CNBC,
US Treasury, US Federal Reserve & US Office of Debt Management, Updated 18 Jan 2011
13 http://www.usgovernmentspending.com/debt_deficit_brief.php
14 http://www.gfmag.com/tools/global-database/economic-data/10394-public-debt-by-
15 https://www.cia.gov/library/publications/the-world-factbook/rankorder/2186rank.html
17 Eliyahu Moshe Goldratt (March 31, 1947 – June 11, 2011) an Israeli physicist, originator of the Optimized Production Technology, the Theory of Constraints (TOC), the Thinking Processes, Drum-Buffer-Rope, Critical Chain Project Management(CCPM), The Goal, and other TOC derived tools.
18 Darrell Huff and Irving Geis, How to Lie with Statistics, (Norton 1993, originally issued 1954)
19 Office for National Statistics: https://www.ons.gov.uk/economy/governmentpublicsectorandtaxes/publicsectorfinance/articles/ukgovernmentdebtanddeficitforeurostatmaastrichtdefinitionalignments/financialyearending2021
20 BBC: https://www.bbc.com/news/business-56962198
21 The Guardian: https://www.theguardian.com/commentisfree/2020/dec/21/britains-national-debt-history-economy
Jonathan: Excellent. Some highlights for me as follows: Krugman shows we don’t need to panic. More important is to insure that DEBT grows more slowly than the tax base. Also interesting is that national DEFICIT increased by 62.2% under trump while it has decreased by 0.9% under Biden. And back to DEBT, with 65% held by US interests, we need not freak out that Japan and China each hold approx 6%. Of course taxes must be levied to pay the interest.
The way you’ve organized this posting makes it much easier to see and understand these important terms.
Q: Is Wrinkled World your invention? Shabash, I like it!
Just received your comments. Thanks for the thoughtful reply!! Wrinkled World comes from a chapter in my proposed book…more on that another tine 🙂
Thanks for the comments….hope to see you this summer
Thanks for the reading and comments…seems like this DEBT topic never ends.
Thanks , I have just been looking for information about this subject for ages and yours is the best I’ve discovered so far. But, what about the bottom line? Are you sure about the source?
Valuable information. Lucky me I found your website by accident, and I’m shocked why this accident didn’t happened earlier! I bookmarked it.
Wow! This can be one particular of the most useful blogs We’ve ever arrive across on this subject. Basically Fantastic. I’m also a specialist in this topic therefore I can understand your hard work.
Thanks for your kind words…I just like to write on things that catch my eye or imagination. I just have trouble reading and responding to so many comments!
If this is the truth then results could possibly be skewed or writer could possibly be unable to draw anysensible conclusions. It is common for teachers to lament that students are strugglingto write despite having done quite well inside the PMR English exam for 15-year-olds.However, it’s also possible to be wondering where you can find good essaywriting examples.
There are some interesting points in time in this article however I don抰 know if I see all of them middle to heart. There is some validity however I’ll take maintain opinion until I look into it further. Good article , thanks and we wish extra! Added to FeedBurner as well
I just couldn’t depart your web site before suggesting that I extremely enjoyed the standard information a person provide for your visitors? Is gonna be back often in order to check up on new posts
I抣l immediately grab your rss feed as I can’t find your email subscription link or e-newsletter service. Do you’ve any? Kindly let me know in order that I could subscribe. Thanks.
You made some nice points there. I looked on the internet for the subject matter and found most people will approve with your blog.
DremBoxBrasil está online! Os mais diversos produtos, de eletrônico à cozinha!
Thanks for your interesting article. Other thing is that mesothelioma is generally the result of the breathing of material from mesothelioma, which is a extremely dangerous material. It can be commonly observed among individuals in the building industry with long contact with asbestos. It’s also caused by residing in asbestos covered buildings for some time of time, Your age plays a crucial role, and some people are more vulnerable to the risk than others.
Pizzaria Pizza Salvador Bahia Rio Vermelho Brasil Delivery http://www.vilaitalia.com.br
Thanks for your tips on this blog. One particular thing I would want to say is the fact that purchasing consumer electronics items through the Internet is certainly not new. The truth is, in the past decade alone, the marketplace for online consumer electronics has grown a great deal. Today, you’ll find practically any specific electronic gizmo and gizmo on the Internet, from cameras and also camcorders to computer spare parts and gambling consoles.
Thanks for your article on this website. From my own personal experience, there are times when softening right up a photograph may well provide the photographer with a little bit of an inventive flare. Oftentimes however, the soft cloud isn’t precisely what you had in your mind and can in many cases spoil an otherwise good image, especially if you thinking about enlarging it.
I do agree with all the ideas you’ve presented in your post. They’re really convincing and will certainly work. Still, the posts are too short for novices. Could you please extend them a bit from next time? Thanks for the post.
What i do not realize is if truth be told how you are no longer actually much more well-preferred than you may be right now. You are so intelligent. You know thus considerably in relation to this subject, produced me for my part imagine it from so many various angles. Its like women and men are not interested except it抯 one thing to accomplish with Girl gaga! Your individual stuffs nice. At all times care for it up!
Thank you for another informative website. The place else could I am getting that kind of info written in such an ideal way? I have a undertaking that I am simply now working on, and I have been on the glance out for such info.
Heya! I just wanted to ask if you ever have any problems with hackers? My last blog (wordpress) was hacked and I ended up losing months of hard work due to no data backup. Do you have any solutions to stop hackers?
I抳e been exploring for a little bit for any high quality articles or weblog posts on this kind of space . Exploring in Yahoo I at last stumbled upon this web site. Reading this info So i抦 happy to exhibit that I’ve an incredibly excellent uncanny feeling I came upon exactly what I needed. I such a lot certainly will make sure to do not put out of your mind this site and give it a look regularly.
I’ve learned a few important things by means of your post. I might also like to say that there may be a situation that you will make application for a loan and don’t need a co-signer such as a Government Student Support Loan. When you are getting credit through a regular creditor then you need to be able to have a cosigner ready to make it easier for you. The lenders will base any decision over a few aspects but the most significant will be your credit ratings. There are some loan merchants that will as well look at your job history and make a decision based on that but in almost all cases it will depend on your score.
Hey I am so grateful I found your website, I really found you by mistake, while I was browsing on Bing for something else, Anyways I am here now and would just like to say thanks for a marvelous post and a all round enjoyable blog (I also love the theme/design), I don抰 have time to go through it all at the minute but I have saved it and also added in your RSS feeds, so when I have time I will be back to read much more, Please do keep up the great work.
Your articles are extremely helpful to me. Please provide more information!
Thank you for your articles. They are very helpful to me. May I ask you a question?
You’ve been great to me. Thank you!
Thank you for your help and this post. It’s been great.
You’ve the most impressive websites.
The articles you write help me a lot and I like the topic
Thanks for posting. I really enjoyed reading it, especially because it addressed my problem. It helped me a lot and I hope it will help others too.
I’d like to find out more? I’d love to find out more details.
Your articles are extremely helpful to me. May I ask for more information?
I enjoyed reading your piece and it provided me with a lot of value.
Good web site! I truly love how it is easy on my eyes and the data are well written. I am wondering how I could be notified whenever a new post has been made. I’ve subscribed to your RSS which must do the trick! Have a nice day!
Thanks for posting. I really enjoyed reading it, especially because it addressed my problem. It helped me a lot and I hope it will help others too.
Nice weblog here! Also your web site so much up very fast! What web host are you the use of? Can I get your affiliate link on your host? I desire my website loaded up as quickly as yours lol my web page: Depi.lt
Thanks for your kind words…I just like to write about things that catch my eye or my imagination. I just have trouble reading and responding to so many comments! I use Namecheap’s WP.
Thank you for providing me with these article examples. May I ask you a question?
So well written, but a bit appeasing. You ok?
Please tell me more about this. May I ask you a question?
The articles you write help me a lot and I like the topic
Thank you for providing me with these article examples. May I ask you a question?
Please tell me more about this. May I ask you a question?
Please tell me more about this. May I ask you a question?
The articles you write help me a lot and I like the topic
Your articles are very helpful to me. May I request more information?
Thanks for your help and for writing this post. It’s been great.
Your articles are extremely helpful to me. Please provide more information!
Thank you for being of assistance to me. I really loved this article.
Thanks for posting. I really enjoyed reading it, especially because it addressed my problem. It helped me a lot and I hope it will help others too.
Can you write more about it? Your articles are always helpful to me. Thank you!
My spouse and I stumbled over here coming from a different website and thought I might check things out. I like what I see so now i am following you. Look forward to finding out about your web page for a second time.
Thanks for the distinct tips discussed on this weblog. I have realized that many insurance carriers offer buyers generous reductions if they prefer to insure more and more cars with them. A significant number of households have got several vehicles these days, specifically those with older teenage youngsters still living at home, and also the savings with policies can easily soon increase. So it pays off to look for a bargain.
Very good written story. It will be supportive to anybody who utilizes it, as well as yours truly :). Keep doing what you are doing – i will definitely read more posts.
I’m still learning from you, but I’m trying to achieve my goals. I absolutely enjoy reading all that is posted on your site.Keep the aarticles coming. I liked it!
Thanks , I have recently been looking for info about this subject for a long time and yours is the best I’ve came upon so far. However, what concerning the conclusion? Are you sure concerning the source?
It is really a great and helpful piece of info. I抦 satisfied that you just shared this helpful info with us. Please keep us informed like this. Thank you for sharing.
I just couldn’t depart your website before suggesting that I extremely loved the standard information an individual supply to your guests? Is gonna be again frequently in order to investigate cross-check new posts
These days of austerity and relative panic about having debt, a lot of people balk contrary to the idea of utilizing a credit card to make acquisition of merchandise as well as pay for a holiday, preferring, instead to rely on this tried plus trusted procedure for making payment – hard cash. However, if you possess cash there to make the purchase 100 , then, paradoxically, that’s the best time for you to use the credit card for several motives.
Hiya! I know this is kinda off topic however , I’d figured I’d ask. Would you be interested in trading links or maybe guest writing a blog article or vice-versa? My blog addresses a lot of the same subjects as yours and I feel we could greatly benefit from each other. If you happen to be interested feel free to send me an email. I look forward to hearing from you! Excellent blog by the way!
My brother suggested I might like this blog. He was totally right.
This post truly made my day. You can not imagine simply how much time I had spent for this info!
Thanks!
Thanks for your kind words…I just like to write about things that catch my eye or my imagination. I just have trouble reading and responding to so many comments!
Hey! I just wanted to ask if you ever have any trouble with hackers? My last blog (wordpress) was hacked and I ended up losing a few months of hard work due to no data backup. Do you have any solutions to protect against hackers?
Hi my friend! I want to say that this post is
amazing, great written and come with almost all vital infos.
I’d like to look more posts like this .
This web site is mostly a walk-by means of for all of the information you wanted about this and didn抰 know who to ask. Glimpse right here, and also you抣l positively uncover it.
My brother recommended I might like this website. He was totally right. This post actually made my day. You can not imagine just how much time I had spent for this information! Thanks!
Thanks for your kind words…I just like to write about things that catch my eye or my imagination. I just have trouble reading and responding to so many comments!
You can certainly see your enthusiasm within the paintings you write. The world hopes for more passionate writers such as you who aren’t afraid to say how they believe. All the time follow your heart.
I have come to understand that service fees for on-line degree experts tend to be an awesome value. For instance a full 4-year college Degree in Communication with the University of Phoenix Online consists of Sixty credits at $515/credit or $30,900. Also American Intercontinental University Online provides a Bachelors of Business Administration with a overall school element of 180 units and a cost of $30,560. Online degree learning has made obtaining your diploma been so detailed more than before because you can certainly earn the degree in the comfort of your house and when you finish working. Thanks for all other tips I have learned from your blog.
I used to be very happy to seek out this net-site.I needed to thanks in your time for this excellent learn!! I positively enjoying every little little bit of it and I have you bookmarked to check out new stuff you weblog post.
Have you ever considered writing an ebook or guest authoring on other websites? I have a blog centered on the same ideas you discuss and would love to have you share some stories/information. I know my audience would appreciate your work. If you’re even remotely interested, feel free to shoot me an e mail.
Viagra
Would you be thinking about exchanging links?
Very nice post. I just stumbled upon your weblog and wanted to say that I have truly enjoyed browsing your blog posts. In any case I will be subscribing to your feed and I hope you write again soon!
It抯 truly a nice and useful piece of info. I抦 happy that you shared this helpful information with us. Please keep us informed like this. Thanks for sharing.
This actually answered my problem, thank you!
It抯 in reality a nice and useful piece of information. I am happy that you shared this helpful information with us. Please stay us informed like this. Thanks for sharing.
Thanks , I have recently been searching for information about this subject for ages and yours is the best I’ve discovered till now. But, what about the conclusion? Are you sure about the source?
One more thing is that while searching for a good on the web electronics shop, look for online stores that are regularly updated, maintaining up-to-date with the latest products, the most beneficial deals, and helpful information on services and products. This will make sure that you are handling a shop that stays over the competition and give you things to make educated, well-informed electronics buying. Thanks for the essential tips I have really learned through your blog.
I’m truly enjoying the design and layout of your website. It’s a very easy on the eyes which makes it much more enjoyable for me to come here and visit more often. Did you hire out a designer to create your theme? Exceptional work!
Hey there! Would you mind if I share your blog with my facebook group? There’s a lot of people that I think would really appreciate your content. Please let me know. Many thanks
I have noticed that online education is getting well-known because obtaining your college degree online has developed into popular alternative for many people. A huge number of people have certainly not had a possible opportunity to attend a regular college or university nonetheless seek the increased earning possibilities and career advancement that a Bachelor’s Degree gives. Still people might have a college degree in one training but would wish to pursue some thing they already have an interest in.
Great paintings! This is the kind of info that are supposed to be shared around the internet. Shame on the seek engines for no longer positioning this publish higher! Come on over and seek advice from my website . Thank you =)
Thanks for expressing your ideas. A very important factor is that students have an option between government student loan and a private education loan where it can be easier to go with student loan consolidating debts than through the federal education loan.
Excellent beat ! I wish to apprentice while you amend your site, how can i subscribe for a weblog website? The account helped me a applicable deal. I had been a little bit familiar of this your broadcast provided brilliant clear idea
F*ckin?amazing things here. I抦 very glad to see your post. Thanks a lot and i am looking forward to contact you. Will you please drop me a mail?
We are a group of volunteers and starting a new scheme in our community. Your website provided us with valuable info to work on. You’ve done an impressive job and our whole community will be thankful to you.
I have figured out some important matters through your blog post. One other thing I would like to state is that there are numerous games available and which are designed mainly for toddler age small children. They include things like pattern acknowledgement, colors, family pets, and patterns. These usually focus on familiarization rather than memorization. This helps to keep children and kids engaged without feeling like they are learning. Thanks
Hmm is anyone else having problems with the pictures on this blog loading? I’m trying to figure out if its a problem on my end or if it’s the blog. Any responses would be greatly appreciated.
Howdy just wanted to give you a quick heads up. The words in your content seem to be running off the screen in Chrome. I’m not sure if this is a formatting issue or something to do with browser compatibility but I figured I’d post to let you know. The design and style look great though! Hope you get the problem resolved soon. Many thanks
Hi there! Do you know if they make any plugins to protect against hackers? I’m kinda paranoid about losing everything I’ve worked hard on. Any tips?
Thanks for giving your ideas on this blog. Also, a misconception regarding the lenders intentions when talking about foreclosure is that the loan company will not have my repayments. There is a certain quantity of time in which the bank will take payments occasionally. If you are far too deep inside hole, they may commonly require that you pay the payment 100 . However, that doesn’t mean that they will not take any sort of installments at all. Should you and the bank can be capable to work something out, your foreclosure practice may cease. However, if you ever continue to miss payments within the new approach, the home foreclosure process can just pick up from where it left off.
I do not even know how I ended up here, but I thought this post was great. I don’t know who you are but definitely you are going to a famous blogger if you aren’t already 😉 Cheers!
Attractive sectjon of content. I just stumbled upon your website and in accession capital to assert thjat I acquire inn fact
enjoyed account your blog posts. Anyuway I’ll be subscribiing to your augment and even I
achievement you access consistently rapidly. https://www.Waste-ndc.pro/community/profile/tressa79906983/
When someone writes an paragraph he/she keeps
the thoughht of a user in his/her brain that how a user can bbe
aware of it. So that’s why this article is perfect.
Thanks! https://www.waste-ndc.pro/community/profile/tressa79906983/
This actually answered my downside, thanks!
Aw, this was a really nice post. In idea I wish to put in writing like this moreover ?taking time and precise effort to make a very good article?but what can I say?I procrastinate alot and in no way appear to get one thing done.
Oh my goodness! an amazing article dude. Thanks However I’m experiencing problem with ur rss . Don抰 know why Unable to subscribe to it. Is there anybody getting an identical rss drawback? Anybody who knows kindly respond. Thnkx
Thanks for the guidelines you have discussed here. Another thing I would like to say is that pc memory demands generally go up along with other advancements in the technology. For instance, any time new generations of cpus are brought to the market, there is usually a similar increase in the shape preferences of both computer system memory along with hard drive space. This is because the software operated by way of these processor chips will inevitably surge in power to use the new technological know-how.
fantastic points altogether, you simply gained a brand new reader. What would you recommend in regards to your post that you made some days ago? Any positive?
I appreciate, cause I found just what I was looking for. You have ended my 4 day long hunt! God Bless you man. Have a great day. Bye
I precisely wanted to say thanks yet again. I’m not certain the things I would have done without those ways revealed by you directly on that topic. It was a traumatic crisis in my position, but discovering your specialised fashion you handled that made me to weep over fulfillment. Now i’m happier for this guidance and even hope you recognize what a powerful job you are always undertaking teaching some other people by way of your webpage. More than likely you have never got to know any of us.
I would like to convey my love for your kind-heartedness supporting people that absolutely need guidance on this theme. Your real dedication to getting the solution up and down came to be really helpful and have continuously encouraged folks like me to attain their endeavors. Your own warm and friendly guide can mean much a person like me and even more to my office workers. With thanks; from each one of us.
Thanks for this enlightening article. It’s been packed with information and provided great insights. If you’re keen on how to boost your real estate business online, make sure to visit https://www.elevenviral.com to learn more.
I was very happy to search out this net-site.I wished to thanks to your time for this excellent read!! I positively having fun with every little little bit of it and I have you bookmarked to check out new stuff you blog post.
What抯 Taking place i’m new to this, I stumbled upon this I have found It positively helpful and it has helped me out loads. I’m hoping to give a contribution & help different users like its aided me. Good job.
I am curious to find out what blog platform you’re working with? I’m having some small security issues with my latest website and I’d like to find something more safeguarded. Do you have any recommendations?
I’ve really noticed that repairing credit activity really needs to be conducted with tactics. If not, you are going to find yourself destroying your position. In order to reach your goals in fixing your credit score you have to take care that from this time you pay any monthly costs promptly before their scheduled date. It’s really significant because by not really accomplishing that area, all other steps that you will decide on to improve your credit rank will not be powerful. Thanks for expressing your thoughts.
limo service offered by airporttransferdfw.com for Dallas/Fort Worth International Airport. This service provides travelers with luxurious and stylish transportation options using limousines. Passengers can book this service for a premium and extravagant travel experience, adding an element of elegance to their airport transfers.
Thank you for this comprehensive guide. The practical tips you’ve shared are going to be very useful for my work.
This is very useful information.
This is one of the best articles I’ve read on this topic.
Hey, Jack here. I’m hooked on your website’s content – it’s informative, engaging, and always up-to-date. Thanks for setting the bar high!
very interesting information! .
I’m so in love with this. You did a great job!!
You helped me a lot by posting this article and I love what I’m learning.
The articles you write help me a lot and I like the topic
Good web site! I truly love how it is easy on my eyes and the data are well written. I am wondering how I could be notified whenever a new post has been made. I’ve subscribed to your RSS which must do the trick! Have a nice day!
Thank you for your help and this post. It’s been great.
I really appreciate your help
Can you write more about it? Your articles are always helpful to me. Thank you!
Your point of view caught my eye and was very interesting. Thanks. I have a question for you.
I don’t think the title of your article matches the content lol. Just kidding, mainly because I had some doubts after reading the article.
Thank you for your sharing. I am worried that I lack creative ideas. It is your article that makes me full of hope. Thank you. But, I have a question, can you help me?
Can you be more specific about the content of your article? After reading it, I still have some doubts. Hope you can help me.
You helped me a lot by posting this article and I love what I’m learning.
Thanks for posting. I really enjoyed reading it, especially because it addressed my problem. It helped me a lot and I hope it will help others too.
Thanks for sharing. I read many of your blog posts, cool, your blog is very good.
Muchas gracias. ?Como puedo iniciar sesion?
I enjoyed reading your piece and it provided me with a lot of value.
Thank you for your sharing. I am worried that I lack creative ideas. It is your article that makes me full of hope. Thank you. But, I have a question, can you help me?
Your article helped me a lot, is there any more related content? Thanks!
Your article helped me a lot, is there any more related content? Thanks!
I’d like to find out more? I’d love to find out more details.
Can you be more specific about the content of your article? After reading it, I still have some doubts. Hope you can help me.
Your point of view caught my eye and was very interesting. Thanks. I have a question for you.
May I request more information on the subject? All of your articles are extremely useful to me. Thank you!
Your articles are extremely helpful to me. Please provide more information!
Your article helped me a lot, is there any more related content? Thanks!
Thank you for writing this post!
Thanks for your kind words…I just like to write on things that catch my eye or imagination. I just have trouble reading and responding to so many comments!
Thanks for sharing. I read many of your blog posts, cool, your blog is very good.
I’d like to find out more? I’d love to find out more details.
Can you be more specific about the content of your article? After reading it, I still have some doubts. Hope you can help me.
Thank you for providing me with these article examples. May I ask you a question?
Good web site! I truly love how it is easy on my eyes and the data are well written. I am wondering how I could be notified whenever a new post has been made. I’ve subscribed to your RSS which must do the trick! Have a nice day!
Thank you for your sharing. I am worried that I lack creative ideas. It is your article that makes me full of hope. Thank you. But, I have a question, can you help me?
I’m so in love with this. You did a great job!!
Your point of view caught my eye and was very interesting. Thanks. I have a question for you.
Great content! Super high-quality! Keep it up!
I’m so in love with this. You did a great job!!
Aw, this was a really nice post. In thought I wish to put in writing like this moreover – taking time and precise effort to make a very good article… however what can I say… I procrastinate alot and in no way appear to get something done.
One thing I would really like to say is that often car insurance cancelling is a dreaded experience so if you’re doing the proper things being a driver you may not get one. Some people do have the notice that they are officially dropped by their particular insurance company they have to struggle to get supplemental insurance after having a cancellation. Cheap auto insurance rates tend to be hard to get after having a cancellation. Understanding the main reasons with regard to auto insurance termination can help owners prevent sacrificing one of the most crucial privileges available. Thanks for the concepts shared by means of your blog.
Yet another thing I would like to express is that in place of trying to suit all your online degree programs on days that you finish work (because most people are worn out when they return), try to obtain most of your lessons on the week-ends and only a few courses for weekdays, even if it means a little time away from your saturdays. This is beneficial because on the week-ends, you will be extra rested as well as concentrated upon school work. Thanks alot : ) for the different ideas I have acquired from your website.
One other issue is when you are in a predicament where you will not have a cosigner then you may really want to try to exhaust all of your money for college options. You will discover many grants and other scholarships and grants that will provide you with money to support with university expenses. Thanks for the post.
We’re a group of volunteers and starting a new scheme in our community. Your website offered us with valuable information to work on. You have done a formidable job and our whole community will be grateful to you.
Great blog here! Also your website loads up fast! What web host are you using? Can I get your affiliate link to your host? I wish my site loaded up as fast as yours lol
I have figured out some new elements from your web site about computer systems. Another thing I have always presumed is that computers have become a specific thing that each residence must have for some reasons. They offer convenient ways to organize households, pay bills, shop, study, listen to music and perhaps watch shows. An innovative technique to complete many of these tasks is a notebook. These pc’s are portable ones, small, highly effective and easily transportable.
I don’t think the title of your article matches the content lol. Just kidding, mainly because I had some doubts after reading the article.
Thanks for sharing. I read many of your blog posts, cool, your blog is very good.
I’m truly enjoying the design and layout of your site. It’s a very easy on the eyes which makes it much more enjoyable for me to come here and visit more often. Did you hire out a designer to create your theme? Great work!
Good – I should definitely pronounce, impressed with your website. I had no trouble navigating through all tabs as well as related information ended up being truly easy to do to access. I recently found what I hoped for before you know it at all. Reasonably unusual. Is likely to appreciate it for those who add forums or something, web site theme . a tones way for your customer to communicate. Excellent task..
Thanks for your write-up. One other thing is that if you are promoting your property all on your own, one of the troubles you need to be conscious of upfront is just how to deal with house inspection reviews. As a FSBO home owner, the key about successfully switching your property and saving money on real estate agent income is awareness. The more you understand, the simpler your property sales effort will probably be. One area in which this is particularly crucial is home inspections.
Your article helped me a lot, is there any more related content? Thanks!
Thank you a lot for providing individuals with an exceptionally wonderful opportunity to read critical reviews from this web site. It really is very great plus full of fun for me personally and my office mates to visit your blog at the very least 3 times in one week to read through the latest things you will have. And of course, I am actually fascinated considering the splendid tricks you serve. Selected 1 tips in this posting are essentially the most beneficial we have all had.
fayjd7
I抳e recently started a web site, the information you provide on this web site has helped me greatly. Thanks for all of your time & work.
I just could not go away your site before suggesting that I actually enjoyed the standard information an individual supply to your guests? Is going to be back incessantly in order to inspect new posts
A different issue is really that video gaming became one of the all-time main forms of fun for people of every age group. Kids enjoy video games, and also adults do, too. Your XBox 360 is just about the favorite gaming systems for people who love to have hundreds of activities available to them, in addition to who like to relax and play live with other individuals all over the world. Thanks for sharing your ideas.
I have been exploring for a little bit for any high-quality articles or weblog posts in this sort of house . Exploring in Yahoo I at last stumbled upon this website. Reading this information So i抦 satisfied to express that I’ve a very just right uncanny feeling I found out exactly what I needed. I most definitely will make certain to do not forget this website and provides it a look on a relentless basis.
I don’t think the title of your article matches the content lol. Just kidding, mainly because I had some doubts after reading the article.
Your article helped me a lot, is there any more related content? Thanks!
I don’t think the title of your article matches the content lol. Just kidding, mainly because I had some doubts after reading the article.
Write more, thats all I have to say. Literally, it seems as though you relied on the video to make your point. You definitely know what youre talking about, why waste your intelligence on just posting videos to your blog when you could be giving us something enlightening to read?
Thank you for your sharing. I am worried that I lack creative ideas. It is your article that makes me full of hope. Thank you. But, I have a question, can you help me? https://www.binance.com/da-DK/register?ref=V2H9AFPY
Quality content is the main to invite the users to visit the site, that’s what this web site is providing.
Thank you for sharing your thoughts. I truly appreciate your efforts and I will be waiting for your next post thanks once again.
Today, with the fast lifestyle that everyone leads, credit cards get this amazing demand in the economy. Persons throughout every area of life are using the credit card and people who not using the credit cards have lined up to apply for just one. Thanks for spreading your ideas about credit cards.
Thank you for your sharing. I am worried that I lack creative ideas. It is your article that makes me full of hope. Thank you. But, I have a question, can you help me? https://accounts.binance.com/en-IN/register?ref=UM6SMJM3
Thanks for helping me to achieve new ideas about pc’s. I also have the belief that certain of the best ways to maintain your notebook computer in excellent condition is with a hard plastic-type material case, or even shell, that matches over the top of one’s computer. These kind of protective gear are usually model unique since they are made to fit perfectly over the natural outer shell. You can buy all of them directly from owner, or from third party sources if they are designed for your laptop, however not all laptop may have a cover on the market. Yet again, thanks for your guidelines.
tvctuf
certainly like your web site but you have to check the spelling on quite a few of your posts. Many of them are rife with spelling issues and I in finding it very troublesome to inform the truth then again I抣l definitely come again again.
That is the right weblog for anyone who wants to search out out about this topic. You notice so much its nearly arduous to argue with you (not that I really would want匟aHa). You definitely put a new spin on a topic thats been written about for years. Great stuff, just nice!
Please tell me more about your excellent articles
Thanks for sharing. I read many of your blog posts, cool, your blog is very good.
I just could not go away your web site prior to suggesting that I really enjoyed the usual info an individual provide on your guests? Is gonna be back steadily to check out new posts
I抳e recently started a site, the info you offer on this site has helped me tremendously. Thank you for all of your time & work.
Today, I went to the beach with my children. I found a sea shell and gave it to my 4 year old daughter and said “You can hear the ocean if you put this to your ear.” She put the shell to her ear and screamed. There was a hermit crab inside and it pinched her ear. She never wants to go back! LoL I know this is entirely off topic but I had to tell someone!
It抯 really a nice and helpful piece of information. I抦 satisfied that you shared this helpful information with us. Please stay us up to date like this. Thank you for sharing.
Your article helped me a lot, is there any more related content? Thanks!
Some genuinely great blog posts on this website , appreciate it for contribution Thanks.
It抯 exhausting to search out educated people on this matter, but you sound like you realize what you抮e speaking about! Thanks
Good day! I know this is kinda off topic nevertheless I’d figured I’d ask. Would you be interested in trading links or maybe guest writing a blog article or vice-versa? My blog discusses a lot of the same subjects as yours and I believe we could greatly benefit from each other. If you’re interested feel free to send me an email. I look forward to hearing from you! Wonderful blog by the way!
I don’t think the title of your article matches the content lol. Just kidding, mainly because I had some doubts after reading the article.
gmbfio
ulw06c
Great post. I was checking constantly this blog and I’m impressed! Very useful info particularly the last part 🙂 I care for such info a lot. I was seeking this particular info for a long time. Thank you and good luck.
Nice blog here! Also your website loads up fast! What host are you using? Can I get your affiliate link to your host? I wish my site loaded up as quickly as yours lol
This is so useful! The advice about tracking expenses is a game-changer. I’ve been using a budgeting app, and it’s made a huge difference. I also wrote a guide on the top apps to use, which your readers might find helpful. Keep up the amazing work!
Excellent goods from you, man. I have understand your stuff previous to and you are just too wonderful. I really like what you’ve acquired here, certainly like what you are stating and the way in which you say it. You make it entertaining and you still care for to keep it smart. I can not wait to read much more from you. This is really a tremendous web site.
excellent points altogether, you just won a new reader. What could you recommend in regards to your publish that you simply made some days in the past? Any sure?
I am so happy to read this. This is the type of manual that needs to be given and not the accidental misinformation that is at the other blogs. Appreciate your sharing this greatest doc.
My developer is trying to convince me to move to .net from PHP. I have always disliked the idea because of the expenses. But he’s tryiong none the less. I’ve been using WordPress on various websites for about a year and am concerned about switching to another platform. I have heard fantastic things about blogengine.net. Is there a way I can import all my wordpress posts into it? Any help would be greatly appreciated!
Your article helped me a lot, is there any more related content? Thanks!
Thank you for your sharing. I am worried that I lack creative ideas. It is your article that makes me full of hope. Thank you. But, I have a question, can you help me?
Can you be more specific about the content of your article? After reading it, I still have some doubts. Hope you can help me.
Your article helped me a lot, is there any more related content? Thanks!
9em91s
v3vnqt
4ab5z2
F*ckin?awesome things here. I am very glad to see your article. Thanks a lot and i am looking forward to contact you. Will you kindly drop me a e-mail?
Can you be more specific about the content of your article? After reading it, I still have some doubts. Hope you can help me.
This actually answered my downside, thank you!
I truly wanted to write a quick note to appreciate you for those splendid guides you are giving on this website. My rather long internet lookup has now been recognized with really good ideas to share with my classmates and friends. I would suppose that many of us website visitors are definitely endowed to dwell in a magnificent place with so many brilliant people with good suggestions. I feel quite blessed to have encountered the website page and look forward to many more cool times reading here. Thank you once more for a lot of things.
Thank you, I’ve just been searching for info about this topic for ages and yours is the greatest I have discovered so far. But, what about the bottom line? Are you sure about the source?
Youre so cool! I dont suppose Ive read anything like this before. So nice to seek out somebody with some original ideas on this subject. realy thank you for beginning this up. this web site is something that is needed on the internet, somebody with a bit originality. helpful job for bringing one thing new to the web!
I don’t think the title of your article matches the content lol. Just kidding, mainly because I had some doubts after reading the article.
I really appreciate your help http://www.hairstylesvip.com
I don’t think the title of your article matches the content lol. Just kidding, mainly because I had some doubts after reading the article.
Can you be more specific about the content of your article? After reading it, I still have some doubts. Hope you can help me.
Thank you for providing me with these article examples. May I ask you a question? http://www.hairstylesvip.com
I don’t think the title of your article matches the content lol. Just kidding, mainly because I had some doubts after reading the article.
Thank you for writing this post! http://www.hairstylesvip.com
Your articles are very helpful to me. May I request more information? http://www.hairstylesvip.com
Can you be more specific about the content of your article? After reading it, I still have some doubts. Hope you can help me.
Your article helped me a lot, is there any more related content? Thanks! https://www.binance.info/join?ref=P9L9FQKY
Thanks for sharing. I read many of your blog posts, cool, your blog is very good.
Thanks for sharing. I read many of your blog posts, cool, your blog is very good. https://accounts.binance.com/en-IN/register-person?ref=UM6SMJM3
Take a look at my web blog :: https://cryptolake.online/crypto7
Thank you for your sharing. I am worried that I lack creative ideas. It is your article that makes me full of hope. Thank you. But, I have a question, can you help me?
Your point of view caught my eye and was very interesting. Thanks. I have a question for you.
Your point of view caught my eye and was very interesting. Thanks. I have a question for you.
Thanks for sharing. I read many of your blog posts, cool, your blog is very good.
Thank you for your sharing. I am worried that I lack creative ideas. It is your article that makes me full of hope. Thank you. But, I have a question, can you help me?
Thanks for sharing. I read many of your blog posts, cool, your blog is very good.
Heey there, You’ve done ann excellent job.
I will definitely digg it and personally suggest to my friends.
I’m confident they’ll be benrfited from this site. https://Menbehealth.wordpress.com/
This is a topic that is near tto my heart… Thank you! Exactly where are your
contact details though? https://menbehealth.wordpress.com/
We are a group of volunteers and opening a new scheme in our community.
Your site provided us with valuable info to work
on. You’ve done a formidable job and our whole community will be graqteful to you. https://menbehealth.Wordpress.com/
Thanks for sharing. I read many of your blog posts, cool, your blog is very good.
My page: https://cryptolake.online/crypto2
Can you be more specific about the content of your article? After reading it, I still have some doubts. Hope you can help me.
Thanks for sharing. I read many of your blog posts, cool, your blog is very good.
Hello! Thiss post couldn’t be written anyy better! Reading
through this post reminds me of my good old room mate!
He always kept talking about this. I will forward this article to
him. Pretty sure he will have a good read. Many thanks for sharing! https://menbehealth.wordpress.com/
When I originally commented I clicked the “Notify me when new comments are added” checkbox and now each time a comment is added I get four e-mails with the same comment. Is there any way you can remove me from that service? Bless you!
Thank you for your sharing. I am worried that I lack creative ideas. It is your article that makes me full of hope. Thank you. But, I have a question, can you help me?
Thank you for your sharing. I am worried that I lack creative ideas. It is your article that makes me full of hope. Thank you. But, I have a question, can you help me?
Your point of view caught my eye and was very interesting. Thanks. I have a question for you.
Can you be more specific about the content of your article? After reading it, I still have some doubts. Hope you can help me.
Thanks for sharing. I read many of your blog posts, cool, your blog is very good.
Your point of view caught my eye and was very interesting. Thanks. I have a question for you.
Can you be more specific about the content of your article? After reading it, I still have some doubts. Hope you can help me.
Your article helped me a lot, is there any more related content? Thanks!
I don’t think the title of your article matches the content lol. Just kidding, mainly because I had some doubts after reading the article.
Your point of view caught my eye and was very interesting. Thanks. I have a question for you.
I don’t think the title of your article matches the content lol. Just kidding, mainly because I had some doubts after reading the article.
Your point of view caught my eye and was very interesting. Thanks. I have a question for you.
Thanks for the sensible critique. Me and my neighbor were just preparing to do a little research on this. We got a grab a book from our area library but I think I learned more from this post. I’m very glad to see such magnificent info being shared freely out there.
Its like you learn my mind! You appear to know a lot approximately this, such as you wrote the guide in it or something. I believe that you simply could do with some to pressure the message home a little bit, however other than that, this is great blog. A fantastic read. I will definitely be back.
Can you be more specific about the content of your article? After reading it, I still have some doubts. Hope you can help me.
F*ckin?amazing things here. I抦 very glad to see your article. Thanks a lot and i’m looking forward to contact you. Will you please drop me a mail?
Good website! I really love how it is easy on my eyes and the data are well written. I’m wondering how I might be notified when a new post has been made. I’ve subscribed to your RSS which must do the trick! Have a nice day!
I do agree with all the ideas you have presented in your post. They are very convincing and will certainly work. Still, the posts are too short for newbies. Could you please extend them a little from next time? Thanks for the post.
Hi, Neat post. There is a problem with your site in internet explorer, would test this… IE still is the market leader and a big portion of people will miss your fantastic writing because of this problem.